
Enhancing the Titanic Data
In Part I, we saw that the model could not be used if the input required to train the model is missing. We have to go back and address this issue before moving forward with the training set, since if there is missing data in the test set then the training set will likely to have the same problem. Our goal in Part II is to “impute” or make estimates based on other information provided, after we identify the missing data.
The Clean Data component can filter “unclean” data with missing values or inconsistent data types. It can also apply default values. First, we would like to identify the problems with the unclean data. The report tells us that only 183 out of 891 records are “clean”. The Cabin and Age data appear to be missing in most cases.
We have established that Cabin is correlated to PClass (passenger class); cabins on decks A-C are first class, D-F are second class, and all others are third class. Having access to cabin information doesn’t provide any other relationship other than the class, which is found for all passengers. As such, we can ignore this attribute and the issues it might lead to. On the other hand, we have already seen that Age might be a good indicator for survival rates, so how can we resolve this?
Predicting Passenger Age
There are various strategies that we might use to estimate Age, if it is not known:
- Use the overall average of passenger age
- Use the average of passenger age by sex
- Use the average age based on other classifications (e.g., class, title)
Using a basic average passenger age is easy enough, and a fair approximation. Dividing the known ages by gender reveals that the average age of the male passengers is 3 years older than the females. What else can we do? We can look at average age by sex and class.
We are building an increasingly accurate “model” of age, based on other attributes.
Extracting the Passenger Title
Is there more information we could use to get a better prediction of age? The Name attribute includes a title (e.g., Mr., Mrs.) and in some cases, the titles can indicate age. For instance, younger male passengers are called “Master”, while younger female passengers are called “Miss”. This may not be as useful, since unmarried women would be referred to as Miss at any age, but it can still help the model. How do we use this?
The title is found in the Name and is always followed by a full stop, a fact that we can use to extract the title.
PilotScript has useful regular expression functions which allow us to create the Title attribute using the extracted pattern from the Name attribute. In this case, it would be any word characters that are followed by a full stop.
A breakdown of the average ages by Sex and Title shows that we can be a little more precise in estimating ages, even though the age data is missing in the test set.
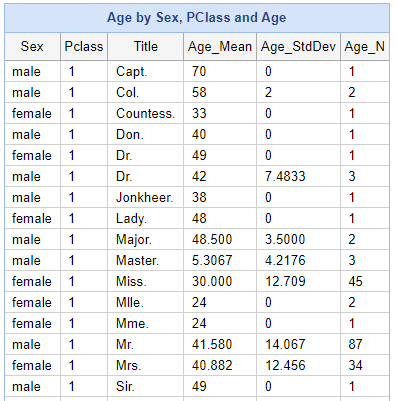
Using Average Age Lookup File
Given that we have seen Title and Pclass are indicators of age, we would like to create a lookup file so that when the passenger’s age is missing, we can insert an estimated value.
First, we can average Age based on Sex, Title and Pclass. Next, we can tidy up our attributes. Sex, Title and Pclass are required for us to add our estimated age data to the data lacking Age; therefore, we need those three attributes. We also have our age estimate, but it’s called Age_Mean and we would prefer it to be called Age. We can do this in a single step.
Finally, we can write out our lookup file to our personal data folder for later (age_lookup.txt).
We now want to use this data to update the training set to fill in missing age values. First, we need to calculate the Title again. Then, we have to separate records which lack Age from those which have the Age.
Pipeline Pilot can insert data from a file, where records in the file match records in the pipeline. In this case, we use Sex, Title and Pclass. We can overwrite the existing age as its empty. Any data which already has an Age can go straight into the report:
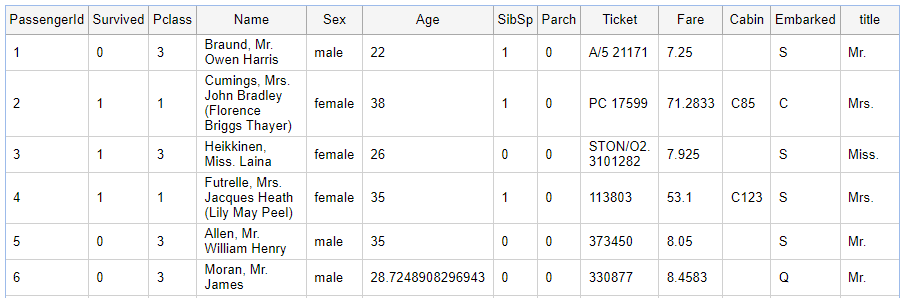
A quick search reveals that James Moran was indeed 28 years old at the time of the sinking, so this method appears to be accurate, at least in some cases.
Visual Data Clean Up
Using the Visual approach, we can perform similar tasks to those we have already (e.g., extract the title from the Name attribute), but we can also perform others. For example, by looking at the distribution of the data, we can see where we might have ambiguousness in the data. The Fare attribute is an example, which has some outliers with very high values. If we were to look more closely, we can see that the fare may represent the price of the ticket, but there may be multiple people travelling on that ticket.
We can also create charts using the data offering potential insights into the overall trends which may be of greater value than simply viewing rows in a table.
Finally, we can produce a component from these interactions, allowing the user to copy these rules to wherever they are needed. Recall we will have to apply to the test set whatever we do to the training set, so being able to easily connect a new component has considerable value.
Saving Updated Training Set
We have performed a reasonable number of feature enhancements to our training data. Therefore, we would like to save that dataset to build further upon it.
By replacing the viewer with a delimited text writer and providing it with the file’s location and desired delimiter, we can easily generate an “enhanced” training set
Building the Next Generation of the Model
Now, let’s see if we can improve our model, using the enhanced data that include the estimated Ages. We build a new model using 75% of this training set. We first test the quality of this new model using an ROC plot, and then apply it to the test set. Note that, we need to apply the same enhancements to the test set as we did to the training set; otherwise, we still won’t be able to make predictions for the passengers with missing record of age.
When we apply the updates to the data, the headline says that we improved the ROC score from 0.845 to 0.884. Our model is now slightly more accurate in its predictions.
Moreover, if we look at our first 6 passenger predictions from the test set, we see that we have corrected our prediction on Mrs. James Wilkes.
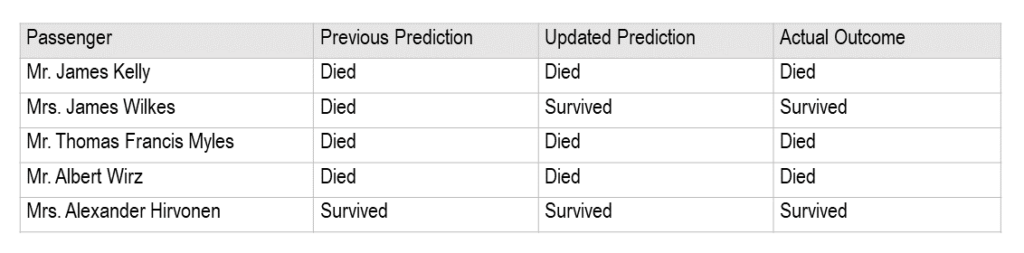
We see that we now have predictions for all passengers. Previously, the model did not predict when the passenger missed an attribute (eg, Age). Now, with the ability to predict their Age, we can make predictions on the outcomes for passengers. Furthermore, by using a reasonable assumption to estimate the Age, we improved the model’s predictions in the process.
To conclude, in the second part of this blog, we demonstrated how to identify errors in the dataset (i.e., missing information, wrong datatype, etc), as well as how to clean up and enhance the data to build an improved, next-generation model.
Pipeline Pilot offers a range of solutions in scientific problems across different disciplines, including biology, chemistry, imaging, laboratory analytics, document search, and many others. If you are interested in learning about our solutions:

Read: Modeling the Titanic Data Set Using BIOVIA Pipeline Pilot Part I

Phil Cochrane has a PhD in organic chemistry, specializing in the synthesis of indole alkaloids, and has amassed over 20 years of experience working with Pipeline Pilot as a services consultant, both independently and as part of Accelrys, where his expertise in chemistry has been highly valuable and earned him a reputation as an industry expert.