In early 2021, the Federal Communications Commission (FCC) granted the mobile wireless industry radio spectrum in the “C-Band,” or 3.7 – 3.98 GHz, to operate 5G transmissions. This band is adjacent to the spectrum used by radar altimeters (4.2 – 4.4 GHz). This approval was made despite the aviation industry informing the FCC in 2018 of the need to ensure that radar altimeters are protected from 5G interference since radar altimeters are key in aircraft safety systems including terrain proximity, autothrottle, and collision avoidance. Afterward, the Federal Aviation Administration(FAA) issued an Airworthiness Directive revising the landing requirements for several aircraft at airports where interference could occur during the approach and landing of aircraft in an airport where 5G is deployed in the vicinity. The directive affected around 2500 aircraft in the US and 8000 worldwide (1).
5G interference mitigation is therefore an important concern, both for the safety of aircraft and the economic viability of 5G deployment. In this blog post, I will show a simulation of a worst-case interference scenario and demonstrate how interference can be analyzed and reduced to acceptable levels using the electromagnetic simulation tools in SIMULIA CST Studio Suite. How can 5G signals interfere with Radar Altimeters?
Interference is more or less electrical noise in an electrical path or a circuit that is caused by an external source. This could happen in two scenarios:
- The operating frequency bands of the two systems are very close to each other, in such a way that the receiving system receives a high level of out-of-band emissions from the emitting system in its operating band.
- The operating frequency bands of the two systems are quite far apart, however a higher harmonic of the emitted spectrum could be received in the operating frequency band of the receiver.
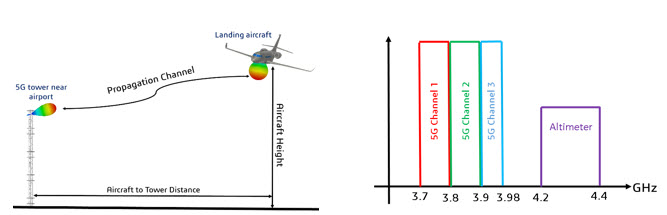
In the case of 5G interference with aircraft altimeter, we are more in the first scenario. The 5G C-band is between 3.7 and 3.98 GHz, which is only 220 MHz away from the altimeter’s operating frequency, which increases the risk of interference especially when the emitter and the receiver are physically close to each other. This is why the interference problem is the most dangerous during the approach and landing of the aircraft, where the altitude of the aircraft above the ground is very crucial. Figure 1.a shows a scenario where the landing aircraft is doing a roll maneuver in the vicinity of a 5G tower (The distance is a function of the horizontal distance between the 5G tower and the aircraft, and the height of the aircraft over the ground).
So how is the transceiver’s spectrum defined? The answer is given in Figure 1.b, where the 5G-C band [3.7 – 3.98] GHz is divided into 3 sub-bands. The current one that is occupied by Verizon has a width of 100 MHz (2). The other ones will be deployed in the near future, where one also has a width of 100 MHz and the last one is 80 MHz wide, which leaves a guard band of 220 MHz between the 5G band and the altimeter band. In fact, each of these 3 bands is divided into smaller 20-MHz-wide bands. This guard band is too small to let the harmonics of the 5G emitter interfere with the altimeter. Thus, the interference is most likely due to the spurious emitted power from the 5G antenna. This will be checked in the next section.

How can SIMULIA CST Studio Suite Help with Predicting the Interference?
In order to predict the interference accurately, we need to:
- Simulate the coupling between the antennas. This is a challenging multiscale scenario that needs to capture both the fine sub-millimeter detail of the antennas and the massive structures of the aircraft and cell tower separated by hundreds or thousands of meters. CST Studio Suite, the electromagnetic simulation package from the SIMULIA brand of Dassault Systèmes, offers multiple solvers with different numerical methods for running hybrid simulations: for example, the time-domain approach to simulate the antenna performance and combining it with the SBR (Shooting and Bouncing Rays) approach, which handles large scale scenarios very efficiently. The hybridization of the methods can be completely bi-directional, which takes into consideration any eventual mismatching of the antenna that may be caused by the platform where it is installed.
- Consider the worst-case scenario that produces the maximum of interference. In our case, we considered that the main lobe of the 5G tower is scanned toward aircraft. At the same time, the aircraft is supposed to perform a roll maneuver with a bank angle of 17 degrees to change its horizontal direction.
Figure 2.a shows an example of the power density plot that is emitted from the 5G antenna toward the aircraft. The simulation is carried out for several horizontal distances (between 100 and 1200 meters) to see how it influences the interference. The heights of the aircraft and the 5G towers are fixed at 100 meters and 30 meters, respectively. Figure 2.b shows the coupling between the 5G antenna and the altimeters for several distances. Naturally, the coupling decreases when the distance increases.

The idea now is to incorporate the coupling parameters in interference calculation. This can easily be done by using the interference task of SIMULIA CST Studio Suite. In addition to the coupling, we need to define the radio parameters for the 5G and the altimeter transceivers. For the emitter (5G) we should specify the number of channels (3) and their width, the emitted power or the PSD (Power Spectrum Density) and the spurious power. The receiver is also specified by the number of channels (1) and their width as well as their sensitivity. The RTCA (Radio Technical Commission for Aeronautics) published in their paper N°274-20/PMC-2073 some numbers regarding the altimeters sensitivity and the emitted power of the 5G antenna (3).
The figures below show the radios used. For the 5G emission, we have considered an urban mast where the antenna has an output peak EIRP (Effective Isotropic Radiated Power) of 70 dBm (or 50 dBm of peak power since the 5G antenna gain is around 20 dBs), with spurious emissions of -20 dBm, leading to a PSD of 50 dBm/MHz. As for the altimeter, we have chosen the properties that suits all the FMCW (Frequency-Modulated Continuous Wave) models, where the protection criterion concerns false altitude information, where the sensitivity is equal to -103 dBm. The altimeter’s saturation is set to -10 dBm.

As an example, we will show the results obtained for a horizontal distance of 100 meters between the 5G tower and the aircraft. The figure to the left shows the received power at the altimeter, while the one to the right shows the EMI margins, both in-band and out-of-band. We can see that there is clearly interference with a high EMI margin, in-band and out-of-band. Clearly, the in-band margins are due to the spurious emission of the 5G antenna.

We can clearly see that for a distance of 100 meters, we have high values of EM margins (all positive) and thus high interference. As a reminder, the interference threshold is set to -10 dB, which means that if the margin is lower than -10 dB we consider no interference. If the margin is between -10 and 0 dB, we consider that the risk of interference is high. Finally, the interference is certain if the margin is higher than 0 dB. These results can be visually interpreted from the violation matrix, given as an output. The colors Green, Yellow and Red tell us in which situation we are, respectively.
Since the coupling decreases when the distance gets bigger, the interference gets lower too. The following table shows the violation matrix for different distance scenarios, varying between 100 and 1200 meters. When the distance gets bigger, we tend toward a complete absence of interference. The corresponding margins for each 5G channel, as a function of the distance, are given in Figure 5.


The previous figure shows clearly that the simplest solution to avoid interference is to avoid deploying a 5G tower near the airport, since increasing the distance reduces the interference. However, this is not always possible – what if the tower that will host the 5G antenna is already deployed within a close range of the airport? The solution lies in adding filters within the transmission chain of both systems with a high out-of-band rejection. The figure to the left below shows the resulting coupling after adding the filters, compared to the original one for a distance of 100 meters. On the right, we can see that the filters help reduce the interference drastically, with margins lower than -10 dB.
Use Simulation to Predict Electromagnetic Interference
RF interference is a very common problem between radio transceivers, and predicting it through simulation helps greatly to reduce unnecessary measurement studies. Most importantly, it helps with creating a safer environment for equipment and for passengers, crew and bystanders. SIMULIA CST Studio Suite has all the tools that allow designing RF systems from the smallest components like antennas and RF components up to the complete communication channel, which allows simulating interference, Channel Impulse Response (CIR) and many other important KPIs.

SIMULIA offers an advanced simulation product portfolio, including Abaqus, Isight, fe-safe, Tosca, SIMPACK, CST Studio Suite, XFlow, PowerFLOW, and more. The SIMULIA Community is the place to find the latest resources for SIMULIA software and to collaborate with other users. The key that unlocks the door of innovative thinking and knowledge building, the SIMULIA Community provides you with the tools you need to expand your knowledge, whenever and wherever.

Hassan Chreim obtained his PhD in Electromagnetism from the University of Limoges – France in 2009. He then worked in the XLIM research lab as a wireless engineer, where he worked on a project in collaboration with the European Space Agency (ESA) that is dedicated to the design of a multi-beam antenna for multi-spots coverage of Europe. Since 2014, he works as an Industry Process Consultant in Dassault Systèmes, focusing mainly on the Aerospace and Defense industry, as well as the High-Tech industry. His area of expertise is electromagnetism in general, mainly antennas and microwave devices, electromagnetic compatibility but also coupling multiple physics together such as electromagnetic-thermal or electromagnetic-structural.