Are you taking some time this summer to read and learn something new? Head on over to the SIMULIA Learning Community for all of your learning needs. Below is a post in our very popular Material Modeling series. As always, registration is free and easy. Join now!
To get the full Excel file that accompanies this post, visit this page.
Brass, load, unload, reload ; bad data
Most of the time the data we have for metals is a monotonic pull test to failure. This brass data is interesting in that it loads out past first yield, then unloads / reloads and pulls a little further, then again unloads / reloads and pulls to failure. In some situations this can be a good way to understand the elastic modulus of a material. This test data is also fairly “bad data” in several ways:
1) It does not start at zero <time, strain, stress>. We would like our test data to start at the <0,0,0> point because our math models start there. Our calibration app can tolerate a bit of zero shift, but significant zero shift should be corrected before calibrating. There is a zero-shift correction tool in the test data processing part of the app.
2) The data, especially out past about 0.1 strain is rather noisy, almost looks like a grip or extensometer was slipping. Equational material models like Johnson-Cook plasticity do a great job with noisy data. Tabular forms can be problematic.
3) The test data has repeated rows. The attached Excel file gives the data in a form without time (leftmost tab) and on another tab gives the data with time. In each case there are some repeated rows. In our calibration app, we need the time sequence to be monotonically increasing.
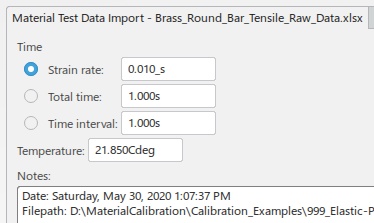
When we import test data into the calibration app, it is best to already have a column of time data recorded during testing. If there is no time information, the app allows the user to choose one of three ways to reconstruct time:

The “Strain rate” method is often the most intuitive and has a default value of strain rate that is considered quasi-static. But if there are repeated rows of strain in the data, then this method will end up with repeated time values, and the imported data will not be valid for use.
The “Total time” method was included in case the user knows the total time of the test but not the strain rate.
The “Time interval” method was included to have at least one method of assigning time that would guarantee a monotonic series of time values. If using the default “Strain rate” method causes problems, it is a good idea to back up and re-import the data using the “Time interval” method.
The calibration app will warn the user about issues with the time:

If one uses the “Strain rate” method of adding time, and ends up with this message, it may be possible to decimate the data to fix the issue. Sometimes this works, other times it gets pretty tedious and one would be best off to re-import using the “Time interval” method.
This brass test data has 596 test data points. There are repeated strain values in rows 346, 348, 350, 351, 381, 383-385, 387-389, 426-427, 429-432, 434-436, 485, 487-492, 494-498 of the Excel file.
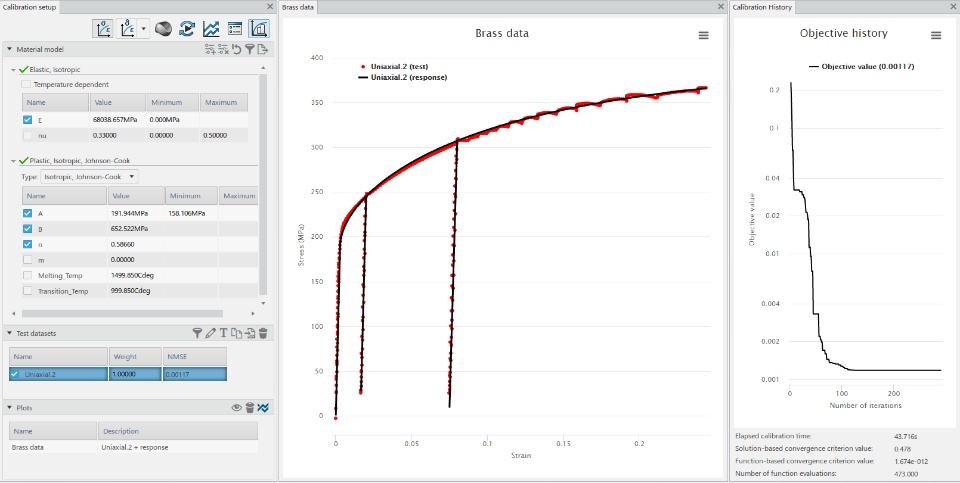
In the image below, I have imported the test data from the 1st tab (w/o time) and used the “Time interval” method with time interval=0.5 sec. I truncated the data to remove data points after ultimate, then calibrated a Johnson-Cook plasticity model.

SIMULIA offers an advanced simulation product portfolio, including Abaqus, Isight, fe-safe, Tosca, Simpoe-Mold, SIMPACK, CST Studio Suite, XFlow, PowerFLOW and more. The SIMULIA Learning Community is the place to find the latest resources for SIMULIA software and to collaborate with other users. The key that unlocks the door of innovative thinking and knowledge building, the SIMULIA Learning Community provides you with the tools you need to expand your knowledge, whenever and wherever.

