
Democratization of electromagnetic simulation is a hot topic that allows designers to leverage the power of simulation early in the design process. 3D simulation tools are very powerful and allow you to analyze the electromagnetic performance of even complex systems, but they have a learning curve and require some experience to be used efficiently. This is where the idea of democratization at Dassault Systèmes SIMULIA comes into play, with the 3DEXPERIENCE platform, we are able to generate web-based dashboards that hide the complexity of the electromagnetic simulation setup and allow designers to obtain reliable results for pre-defined use cases.
Typically, a simulation analyst will set up the electromagnetic simulation model and make sure that all simulation settings are correct. Then, they will build a dashboard to interface with the simulation model and publish this dashboard to colleagues that would like to run this simulation (App: “Process Experience Studio”).
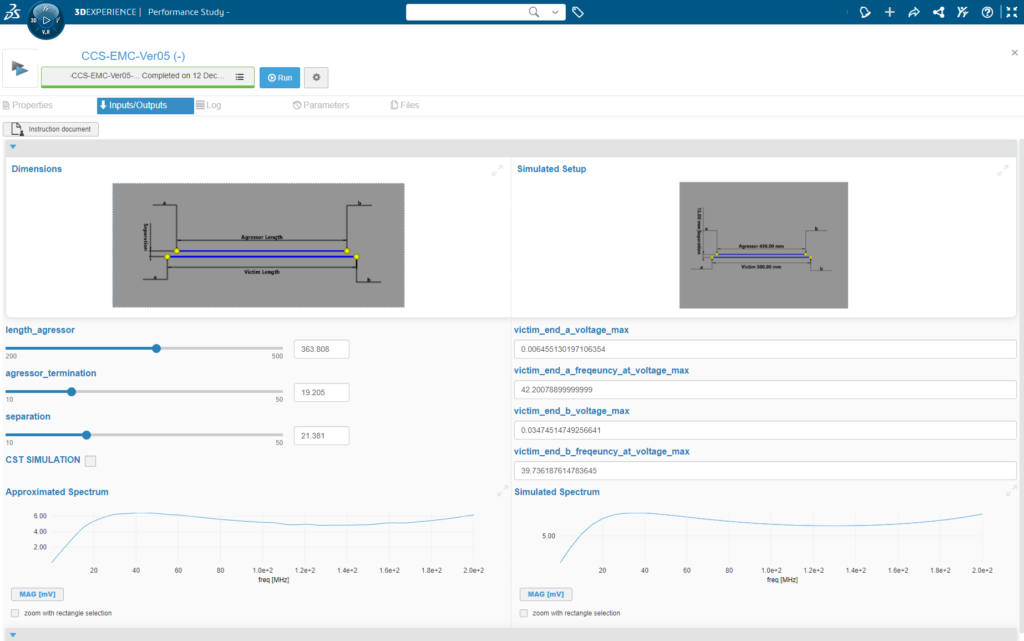
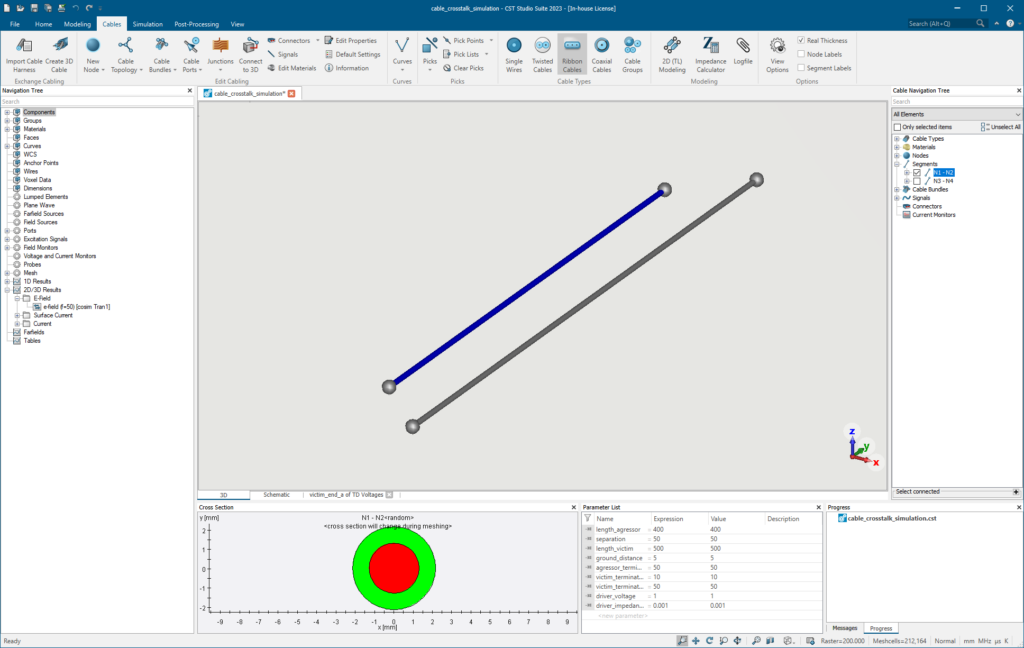
In this example, we have chosen the electromagnetic simulation of cable crosstalk as a demonstration model. The simulation was set up in CST Studio Suite. It consists of two cables: one aggressor and one victim. The distance between the cables, the length of the aggressor and the termination of the aggressor were parametrized. The results of interest are defined as the crosstalk at the ends of the victim cable. We calculate the maximum value of the crosstalk in Volt and also the frequency at which this highest crosstalk occurs. For the input parameters, simple sliders will be used on the dashboard.
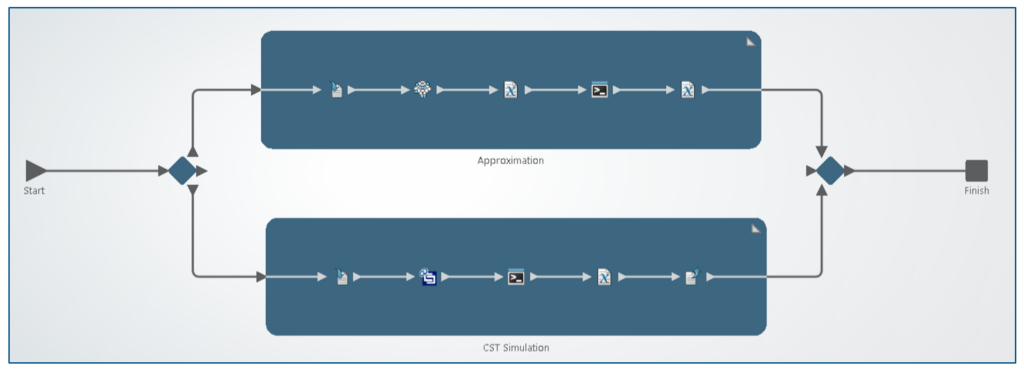
The dashboard offers two ways to obtain simulation results:
- A direct simulation of the model: The simulation model will run directly (on the cloud or locally) and the simulation results are displayed in the browser. This is the most accurate approach as the simulation with the given input parameter is executed.
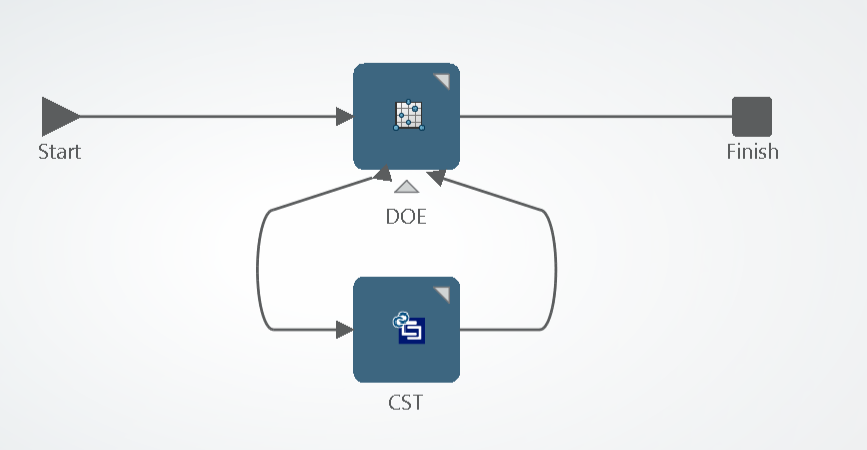
- An approximation model: This is a very fast execution type as it does not require you to execute the simulation. What we do is first run a DOE (Design of Experiment) on the simulation model and then generate an approximation from it.
The generation of the approximation is performed using the app “Simulation Process Composer.” It is a design space exploration type of simulation where the input parameters are chosen according to an algorithm (Full Factoral) and the generated results are fitted using Radial Basis Functions (The Result Analytics App offers different methods to fit the results). Once the approximation is generated, it can be saved and evaluated through the dashboard, which takes only a few seconds.
One of the problems we have encountered during the generation of the approximation that the output results behave different. For the maximal value of the crosstalk, the approximation works excellent. However, for the frequency at which the maximum crosstalk occurs, the approximation is not accurate. The reason for this is how the data behaves: max crosstalk is a smooth function but the frequency of max crosstalk is not. For certain parameter values the max crosstalk is in the frequency band we have defined, for others it is at the upper end of the band. This leads to a non-smooth behavior which is not well approximated by radial basis functions.
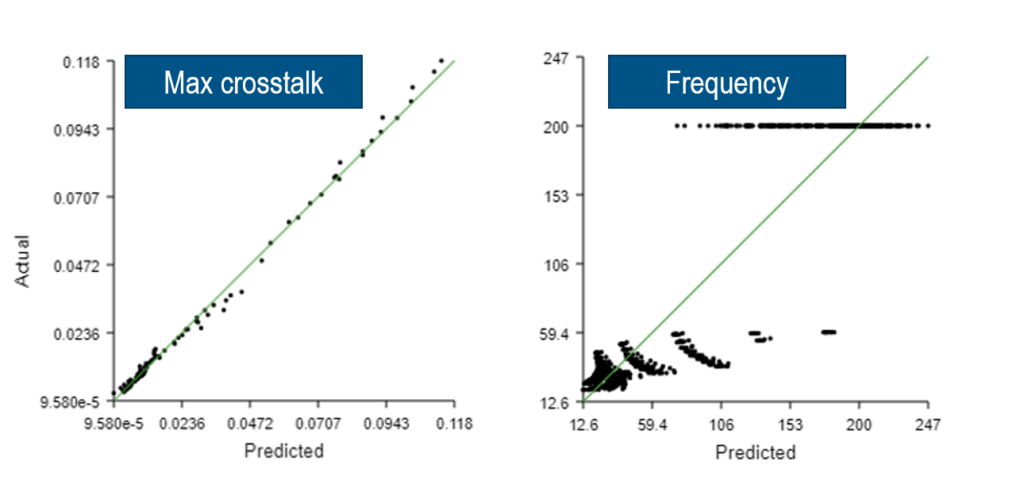
In order to solve this problem we have decided to first calculate the approximation on a number of frequency samples (100) and extract the frequency at which the crosstalk occurs from the approximation. This is numerically much more stable and delivers reliable results. It also allows to plot the complete approximated spectrum and not only the frequency at which the maximum occurs. The generation of the approximate model at such high number of sampling point was automatized using a python script. This is the nice thing about process composer, it allows you to plug in your own post processing, for example by Python but also Excel and so on. Once this was done we have a really nice simulation dashboard that is very easy to use. Also, we have added a functionality that generates an image from the simulation model to inform the user about what they actually simulated.
With these powerful tools on the 3DEXPERIENCE platform and the power of CST Studio Suite, we can offer electromagnetics simulation to designers and allow them to make more informed decisions early on in the design stage.
Interested in the latest in simulation? Looking for advice and best practices? Want to discuss simulation with fellow users and Dassault Systèmes experts? The SIMULIA Community is the place to find the latest resources for SIMULIA software and to collaborate with other users. The key that unlocks the door of innovative thinking and knowledge building, the SIMULIA Community provides you with the tools you need to expand your knowledge, whenever and wherever.

Andreas is a senior solution consultant for electromagnetic simulation at Dassault Systèmes in Darmstadt, Germany. After receiving his PhD in numerical electromagnetics from the Darmstadt University of Technology in 2007 he joined CST which later became a part of Dassault Systèmes. His main interest lies in the simulation of electromagnetic compatibility of electronic systems, ranging from high-speed to power electronics.