
* Example of advanced styling
TIP: Please note custom symbols can be created and loaded into the Data Visualizer function by saving the corresponding symbol as a string file into this location:
C:UsersPublicGEOVIASurpac<Surpac_version>shareresourcescriptsstructural_suitesymbols’.
When saving the symbol into string file format, the Purpose field in the save form must be filled, as this will be the name displayed in the Symbol drop down menu. The symbol itself should be digitised in plan view and be ~1m across in size (to be consist with the scaling convention of the other symbols). GEOVIA Surpac must be restarted before the new symbol will appear in the function.
iv. On the fourth tab Coloring Styles, select the field to color by and the Autostyle to use (e.g. Rainbow). To disable colouring untick Use Coloring.
v. Click Apply to view the symbols on screen. See image at top of post for example of the output.
In PART 2 of this GEOVIA Blog post we will look at the following Structural Suite functions:
• Create stereographic projection from selected data • Create Planes from stereographic projection • Dip/dip direction of the intersection line of two planes
* Example of simple styling
* Example of advanced styling
TIP: Please note custom symbols can be created and loaded into the Data Visualizer function by saving the corresponding symbol as a string file into this location:
C:UsersPublicGEOVIASurpac<Surpac_version>shareresourcescriptsstructural_suitesymbols’.
When saving the symbol into string file format, the Purpose field in the save form must be filled, as this will be the name displayed in the Symbol drop down menu. The symbol itself should be digitised in plan view and be ~1m across in size (to be consist with the scaling convention of the other symbols). GEOVIA Surpac must be restarted before the new symbol will appear in the function.
iv. On the fourth tab Coloring Styles, select the field to color by and the Autostyle to use (e.g. Rainbow). To disable colouring untick Use Coloring.
v. Click Apply to view the symbols on screen. See image at top of post for example of the output.
In PART 2 of this GEOVIA Blog post we will look at the following Structural Suite functions:
• Create stereographic projection from selected data • Create Planes from stereographic projection • Dip/dip direction of the intersection line of two planes
ii. The second tab Constraints is optional and can be disabled by unticking Define Constraints. This tab allows the user to constrain which symbols are displayed on screen by using drillhole or data table constraints.
iii. On the third tab choose between simple and advanced styles for the structural symbols. These settings control the symbol shape, size and application (e.g. 3D or 2D). To disable symbols untick Create symbols. Examples of simple and advanced styling are given below:
* Example of simple styling
* Example of advanced styling
TIP: Please note custom symbols can be created and loaded into the Data Visualizer function by saving the corresponding symbol as a string file into this location:
C:UsersPublicGEOVIASurpac<Surpac_version>shareresourcescriptsstructural_suitesymbols’.
When saving the symbol into string file format, the Purpose field in the save form must be filled, as this will be the name displayed in the Symbol drop down menu. The symbol itself should be digitised in plan view and be ~1m across in size (to be consist with the scaling convention of the other symbols). GEOVIA Surpac must be restarted before the new symbol will appear in the function.
iv. On the fourth tab Coloring Styles, select the field to color by and the Autostyle to use (e.g. Rainbow). To disable colouring untick Use Coloring.
v. Click Apply to view the symbols on screen. See image at top of post for example of the output.
In PART 2 of this GEOVIA Blog post we will look at the following Structural Suite functions:
• Create stereographic projection from selected data • Create Planes from stereographic projection • Dip/dip direction of the intersection line of two planes
c. Then launch Structural Suite > Data Visualizer The following form will be displayed, navigate through the tabs left to right.
i. On the first tab Data Source select the table containing the structural measurements and select the preferred directional notation and fields that will orientate the structural symbols (e.g. dip and dip_direction).
ii. The second tab Constraints is optional and can be disabled by unticking Define Constraints. This tab allows the user to constrain which symbols are displayed on screen by using drillhole or data table constraints.
iii. On the third tab choose between simple and advanced styles for the structural symbols. These settings control the symbol shape, size and application (e.g. 3D or 2D). To disable symbols untick Create symbols. Examples of simple and advanced styling are given below:
* Example of simple styling
* Example of advanced styling
TIP: Please note custom symbols can be created and loaded into the Data Visualizer function by saving the corresponding symbol as a string file into this location:
C:UsersPublicGEOVIASurpac<Surpac_version>shareresourcescriptsstructural_suitesymbols’.
When saving the symbol into string file format, the Purpose field in the save form must be filled, as this will be the name displayed in the Symbol drop down menu. The symbol itself should be digitised in plan view and be ~1m across in size (to be consist with the scaling convention of the other symbols). GEOVIA Surpac must be restarted before the new symbol will appear in the function.
iv. On the fourth tab Coloring Styles, select the field to color by and the Autostyle to use (e.g. Rainbow). To disable colouring untick Use Coloring.
v. Click Apply to view the symbols on screen. See image at top of post for example of the output.
In PART 2 of this GEOVIA Blog post we will look at the following Structural Suite functions:
• Create stereographic projection from selected data • Create Planes from stereographic projection • Dip/dip direction of the intersection line of two planes
b. For surface structural measurements: Surface structural measurements should be stored within the database inside a discrete table before starting the Data Visualizer function. The mandatory fields within this table are samp_id, x, y and z. Optional field examples include: dip, dip_direction, strike, alpha and beta. Example:
c. Then launch Structural Suite > Data Visualizer The following form will be displayed, navigate through the tabs left to right.
i. On the first tab Data Source select the table containing the structural measurements and select the preferred directional notation and fields that will orientate the structural symbols (e.g. dip and dip_direction).
ii. The second tab Constraints is optional and can be disabled by unticking Define Constraints. This tab allows the user to constrain which symbols are displayed on screen by using drillhole or data table constraints.
iii. On the third tab choose between simple and advanced styles for the structural symbols. These settings control the symbol shape, size and application (e.g. 3D or 2D). To disable symbols untick Create symbols. Examples of simple and advanced styling are given below:
* Example of simple styling
* Example of advanced styling
TIP: Please note custom symbols can be created and loaded into the Data Visualizer function by saving the corresponding symbol as a string file into this location:
C:UsersPublicGEOVIASurpac<Surpac_version>shareresourcescriptsstructural_suitesymbols’.
When saving the symbol into string file format, the Purpose field in the save form must be filled, as this will be the name displayed in the Symbol drop down menu. The symbol itself should be digitised in plan view and be ~1m across in size (to be consist with the scaling convention of the other symbols). GEOVIA Surpac must be restarted before the new symbol will appear in the function.
iv. On the fourth tab Coloring Styles, select the field to color by and the Autostyle to use (e.g. Rainbow). To disable colouring untick Use Coloring.
v. Click Apply to view the symbols on screen. See image at top of post for example of the output.
In PART 2 of this GEOVIA Blog post we will look at the following Structural Suite functions:
• Create stereographic projection from selected data • Create Planes from stereographic projection • Dip/dip direction of the intersection line of two planes
The modelling of structural geology is often an over-looked, misunderstood and under-utilized facet of the mining process, where deeper knowledge of structural trends can provide vital insights into design considerations, safety, ore genesis and structural controls on mineralization.
With the release of the GEOVIA Surpac 6.9 Structural Suite, geologists now have the capability to visualise, interpret and plot these trends. The key benefits and use cases of this toolset are outlined in the GEOVIA Blog post, entitled ‘Extending Geology Modeling for Structural Geologists with the Surpac Structural Suite’.
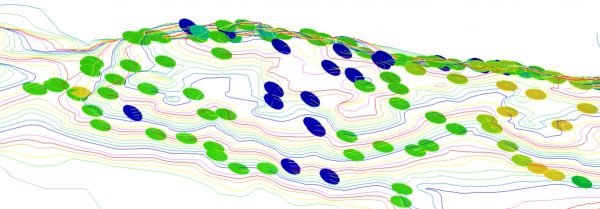
*Structural symbols visualising the dip of a bedding plane across an area. (Contains OS data © Crown copyright and database right 2013.)
In part 1 of this 3 part GEOVIA blog post series we will discuss some of the key functions available within the Surpac Structural Suite of tools.
Today we will look at its location within GEOVIA Surpac software (version 6.9 or newer) and explain in detail the Data visualizer function. The Structural Suite toolset is located under the Database menu > Structural Suite submenu. It contains 24 functions.
1) HOW TO DISPLAY STRUCTURAL MEASUREMENTS IN GEOVIA SURPAC
The featured function in this post, is the Data Visualizer which will require a Surpac drillhole database to be open before use. Downhole and surface structural measurements can be visualised with this function following the workflow below:
a. For downhole structural measurements: Firstly, downhole structural measurements should be stored within the database inside a point table before starting the Data Visualizer function. The mandatory fields within this table are hole_id and depth_to. Optional field examples include: dip, dip_direction, strike, alpha and beta. Example:
b. For surface structural measurements: Surface structural measurements should be stored within the database inside a discrete table before starting the Data Visualizer function. The mandatory fields within this table are samp_id, x, y and z. Optional field examples include: dip, dip_direction, strike, alpha and beta. Example:
c. Then launch Structural Suite > Data Visualizer The following form will be displayed, navigate through the tabs left to right.
i. On the first tab Data Source select the table containing the structural measurements and select the preferred directional notation and fields that will orientate the structural symbols (e.g. dip and dip_direction).
ii. The second tab Constraints is optional and can be disabled by unticking Define Constraints. This tab allows the user to constrain which symbols are displayed on screen by using drillhole or data table constraints.
iii. On the third tab choose between simple and advanced styles for the structural symbols. These settings control the symbol shape, size and application (e.g. 3D or 2D). To disable symbols untick Create symbols. Examples of simple and advanced styling are given below:
* Example of simple styling
* Example of advanced styling
TIP: Please note custom symbols can be created and loaded into the Data Visualizer function by saving the corresponding symbol as a string file into this location:
C:UsersPublicGEOVIASurpac<Surpac_version>shareresourcescriptsstructural_suitesymbols’.
When saving the symbol into string file format, the Purpose field in the save form must be filled, as this will be the name displayed in the Symbol drop down menu. The symbol itself should be digitised in plan view and be ~1m across in size (to be consist with the scaling convention of the other symbols). GEOVIA Surpac must be restarted before the new symbol will appear in the function.
iv. On the fourth tab Coloring Styles, select the field to color by and the Autostyle to use (e.g. Rainbow). To disable colouring untick Use Coloring.
v. Click Apply to view the symbols on screen. See image at top of post for example of the output.
In PART 2 of this GEOVIA Blog post we will look at the following Structural Suite functions:
• Create stereographic projection from selected data • Create Planes from stereographic projection • Dip/dip direction of the intersection line of two planes

Ross is a qualified Resource Geologist with 9 years' industry experience in database management, geological modeling, grade control, geostatistics, resources estimations and process mapping. Since joining GEOVIA, Ross has worked with and assisted mining clients across Europe, Middle East and Africa. His commodity experience includes gold, copper, lead, zinc, iron, coal, bitumen and various industrial minerals. He regularly delivers support, training and consultancy services in GEOVIA Surpac, GEOVIA Minex, GEOVIA MineSched and various roles on the 3DEXPERIENCE Platform. Ross is based in Coventry, UK.