
It is nigh-on impossible not to be amazed at the broad capabilities of the latest generation of “foundation” (or “general-purpose AI”, or GPAI) models. But for those of us data scientists not in this “supply chain” [1] there is still value to be had from our day-to-day activities in developing “narrow” models.
Certainly in the chemistry world, even though QSAR is evolving almost beyond recognition, we can do this to our advantage, as we describe below.
Dreams within Dreams
The context is to “model” the QSAR development process itself. In other words, see if we can reasonably predict whether we will have a successful model at the end of all of our structure cleaning, descriptor generation, machine-learning, and so on.
A nice step forward in this was the creation of the MODI (Modelability Index) algorithm [2], which given a QSAR data set outputs a number between 0 and 1 which (for this author at least) corresponds to the belief that things will work out.
But this algorithm scales as the square of the number of structures, and so may not meet the “political” goals of expediency in getting on with the QSAR process, especially with the larger volumes of data we all now seem to have.
But it is simple enough to “model the model of the model”. In other words, build a predictive model for small fractions of the data set which extrapolates to the MODI of the entire data set.
This has the not-insignificant benefit of reducing the carbon footprint of our “AI” activities. We don’t intend to go into detail here, simply quote an estimate that the daily running of one particular LLM generates about the same amount of CO2 (if only on the servers which host the model) as me driving my car to work and back [3].
How To Do It
The tool of choice for this author is BIOVIA Pipeline Pilot. This supports the essential activities for us to create our virtual world-within-a-world-within-a-world:
- Automate
- Parameterise
- Analyse
These activities are embodied in the protocol shown below:
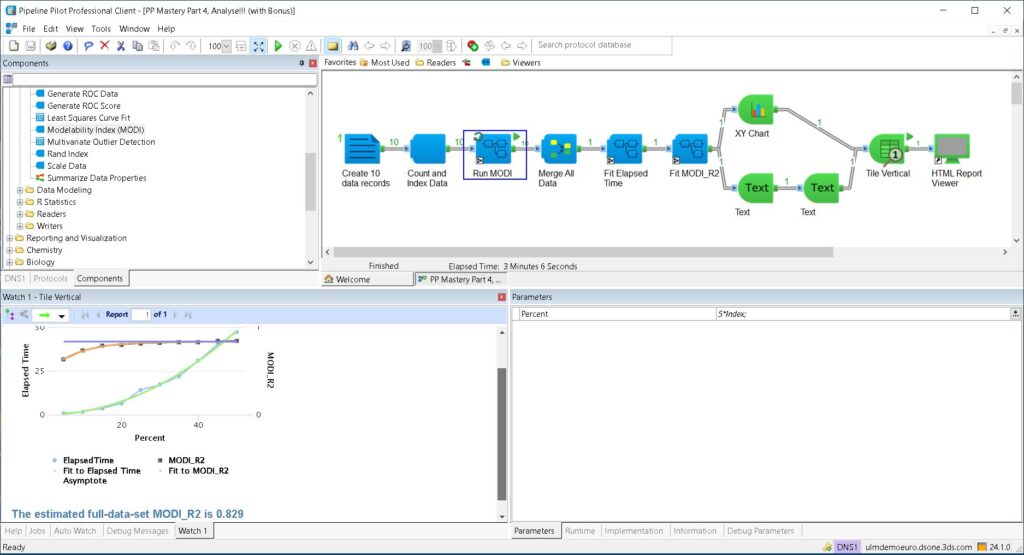
The Automation is encapsulated in the “Run MODI” subprotocol, which runs in this case 10 times. Parameterisation is shown in the Parameters pane, lower-right, where for each MODI run we increase the percent of data used by 5. Finally, the Analysis is the right-half of the protocol, where we do some least-squares curve-fitting, and make a nice report (remembering the adage that the nicer the report, the more people will like its contents).
With out-of-the-box components for MODI, Least-Squares Curve Fit, XY Chart and other utility components, the protocol above took me only about 15 minutes to create.
The “final” result is shown in thumbnail form in the “watch” window at lower left, where the upper orange curve shows the fit of the MODI versus the percent of the data used to a rising exponential; we have also drawn the asymptote in blue. The lower curve confirms the assertion from [2] that the calculation time scales as the square of the data set size.
The predicted full-set MODI of 0.829 should be enough to get us going on the QSAR process itself, secure in the knowledge that whilst we may not be trendy, we will still get a good, though narrow, result.
References
[1] https://www.adalovelaceinstitute.org/resource/foundation-models-explainer/
[2] MODI was first proposed for categorical responses by A. Golbraikh, E. Muratov, D. Fourches, and A. Tropsha, “Data Set Modelability by QSAR,” J. Chem. Inf. Model., 54, pp. 1-4 (2014). (https://pubs.acs.org/doi/10.1021/ci400572x)

Principal Scientist at Dassault Systemes BIOVIA working to ensure the success of both BIOVIA and its customers whose main focus is software to support the process of efficient experimentation, and management of the knowledge which this generates. A secondary focus is integration - pulling together software, data and people into novel situations which generate value.