
Introduction
Additive Manufacturing (AM) software is a relatively new process, yet it can be optimized using many of the same approaches similar to traditional processes. This blog post serves as a demonstration of how imaging analytics, machine learning, and AI can be used to create a “model-based predictive control” capability for AM optimization. Imaging analytics can be used to quantify the AM process, gathering data for further analysis. With this information, machine learning and AI-based models can be used to predict potential problems and optimize the process accordingly.
Our small demonstration answers the simple question, “Are we printing what we intended to print?” To quantify our answer to this question (the first step towards the most straightforward type of analytics: “descriptive analytics”) we need to instrument our printing apparatus and analyze the data coming from it.
We have obtained images from a partner, CESI [1], who have instrumented their laser powder bed fusion (LPBF) process with a camera, providing images such as the following:
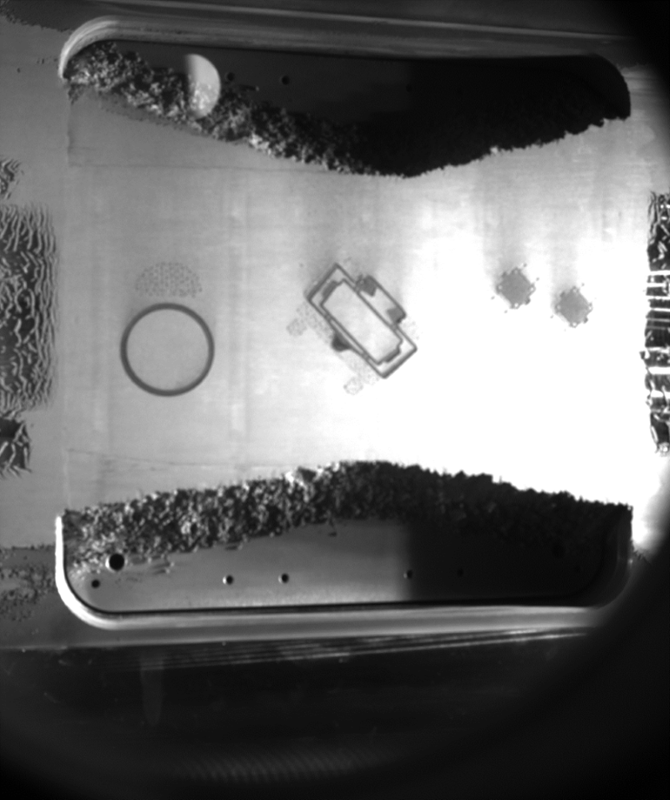
Figure 1: Image of a Part Being Printed via Laser Powder Bed Fusion
We focus attention on the rather complex part in the center of the bed, but in passing note that the process of capturing this image is itself one which needs to be optimized. Optimal camera position and lighting are not trivial, as noted in other examples of image analytics for manufacturing [2]. The shadows in the above should not be mistaken for printing artifacts.
However, given what we have, we simply ask the question “can we accurately place the shape of the intended part (layer) over the corresponding layer image, and then quantify deviations in a variety of ways?”
Image Analytics with BIOVIA Pipeline Pilot
The answer is a (relatively) simple “Yes,” using the image analytics capabilities in BIOVIA Pipeline Pilot.
This offers a “toolkit” of components within the “visual programming” paradigm depicted below:
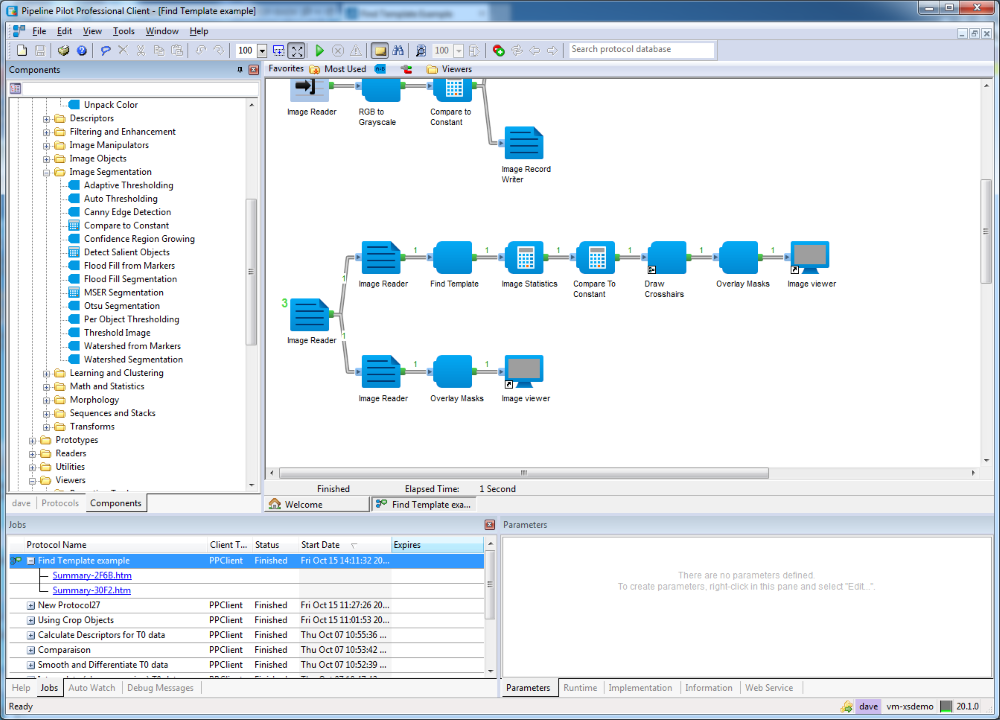
Fig 2: A Pipeline Pilot Protocol Which Does Image Analytics on Fig. 1
Here we see on the left part of UI the component “library”, and on the right a specific “protocol” which answers the above question. In general, having a protocol answer a specific question is a good approach.
Conclusion
Without going into too much detail, the protocol:
- Reads in the known shape of the layer in the part,
- Reads in the image of the layer,
- Searches for a “best match” positioning of this on the image,
- Returns detailed (pixel-level) statistics about the matching process, as well as any additional statistics required (e.g. quantifying the alignment of the layer outlines).
In keeping with the data pipelining approach, the above protocol could run over all layers with minimal changes.
We show below the result of the second (alignment) step, zoomed in to a full-size image:
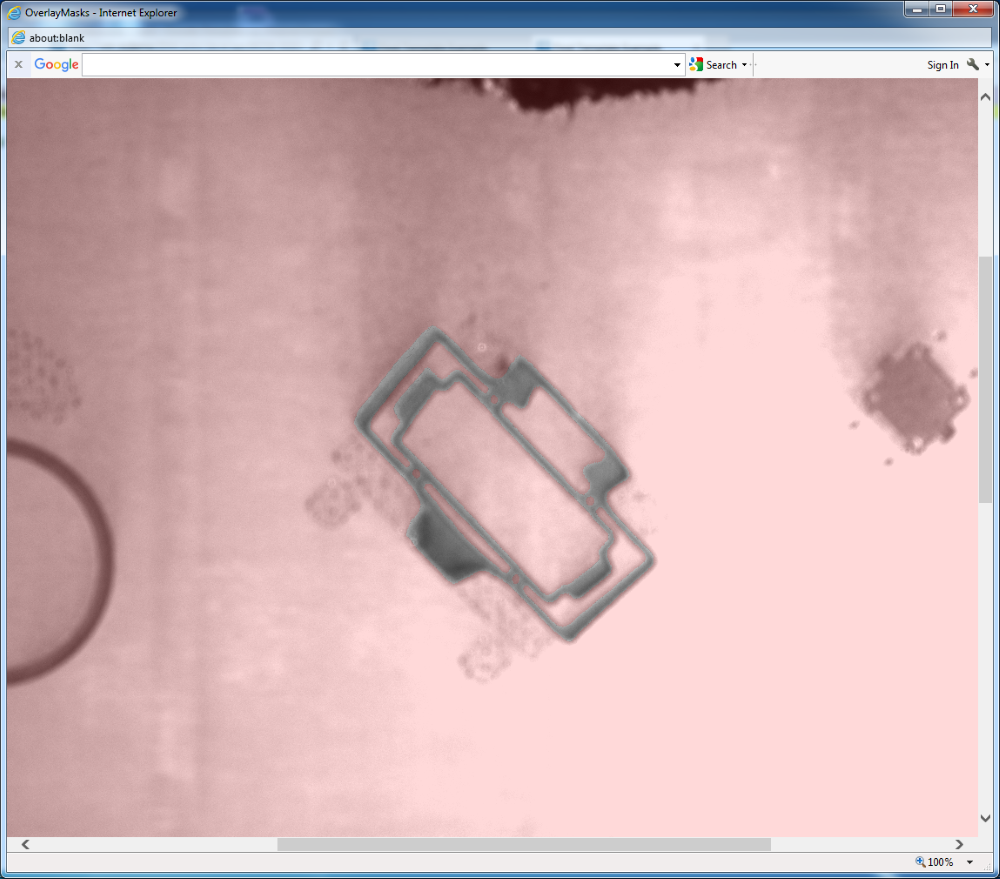
Figure 3: “As-Designed” Image Overlaid on the Printed Part Image
The alignment is clearly good and can achieve an accuracy of a pixel or two.
However, there are “artifacts” within and without the layer outline. More problematic is classifying these into image artifacts versus print artifacts. Our investigation will now focus on this step.
References
[1] L. Reyes, T. Baur, JD. Penot, CESI, Département R&I, https://paris.cesi.fr/
[2] https://www.kaggle.com/ravirajsinh45/real-life-industrial-dataset-of-casting-product

Principal Scientist at Dassault Systemes BIOVIA working to ensure the success of both BIOVIA and its customers whose main focus is software to support the process of efficient experimentation, and management of the knowledge which this generates. A secondary focus is integration - pulling together software, data and people into novel situations which generate value.