Abstract
In this blog post, we show a benchmark example of gas discharge simulation with Spark3D. The benchmark compares Spark3D breakdown simulation results to measurements performed by Exens Solutions (Gradignan plant) in a lowpass waveguide filter operating in Ka-Band.
Introduction
Today microwave applications in communications satellite systems demand higher and higher transmission rates. This is achieved by the use of larger bandwidths, higher frequencies and higher power levels. All these trends lead to higher electric field densities inside components, which in turn leads to serious problems with respect to RF breakdown.
In particular, gas breakdown is a process by which an electron plasma is formed due to the ionization of the gas surrounding a zone of high electric field. In satellite applications, this phenomenon only occurs under certain situations, because the satellite operates under vacuum conditions. For instance, during the launch, the Telemetry, Tracking and Control (TTC) system is switched on and gas breakdown can take place. In addition, an increasing attention is being paid to gas breakdown in the case of reentry vehicles for reusable launch systems or for the exploration of solar system bodies such as Mars.
The consequences of a gas discharge in a microwave component are extremely harmful. First, the reflected power considerably increases, which can indeed harm the power source. In addition, due to this higher reflection, the temperature significantly rises, which can burn the device itself. The prevention of gas discharge relies on the careful design of the satellite subsystems. Therefore, the microwave designer needs to determine the maximum input power that a particular device can withstand without developing a discharge.
Before describing the benchmark example, we introduce the specific tools that we have used in the whole process.
SIMULIA Electromagnetic Simulation Technology
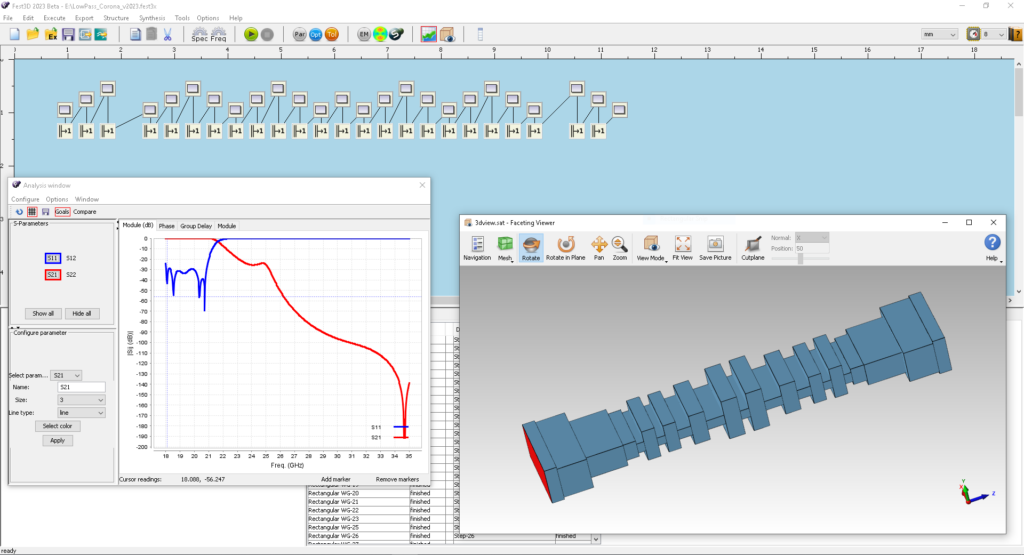
Fest3D is a software tool capable of analyzing complex passive microwave components based on waveguide and coaxial cavity technology very efficiently. This is achieved by a divide-and-conquer approach. First, the different parts or sections of the device are solved with the most efficient method. These individual components are shown as small blocks in the interface (Fig. 1). Then, these components are connected to each other as indicated by the lines in Fig. 1. At the interfaces (ports) the field coupling from one component to the next is calculated using the electromagnetic (EM) modal expansion.
In addition to its analysis capabilities, Fest3D also offers advanced automatic synthesis tools that simplify the design of bandpass, dual-mode and lowpass filters based on waveguide technology.
Spark3D is a unique simulation tool for determining the RF breakdown power level in a wide variety of passive devices. Electromagnetic field results from Fest3D and CST Studio Suite® can be imported directly into Spark3D to analyze vacuum breakdown (multipactor) and gas discharge (corona). Spark3D calculates the maximum power that the device can withstand without causing RF breakdown.
Design of the Lowpass Filter Used in This Benchmark
Exens Solutions (Gradignan plant) microwave RF experts designed a corrugated waveguide lowpass filter with a cut-off frequency of 21 GHz using Fest3D. In Fig. 1, we show the 3D view and the electrical response of the model. For this filter, Fest3D computes the S-parameters in the complete frequency range in less than one second.
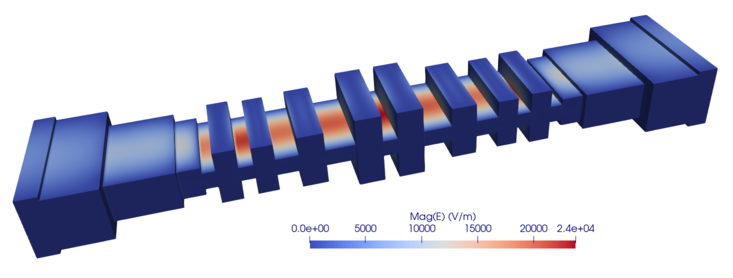
The first step to performing the high power analysis is to compute the electromagnetic field distribution inside the device. As an example, in Fig. 2, we show the electric field distribution at 19.375 GHz. The location of the maximum electric field strength typically indicates the location of the discharge. In this case, the maximum electric field strength occurs in the narrowest section at the center of the device.
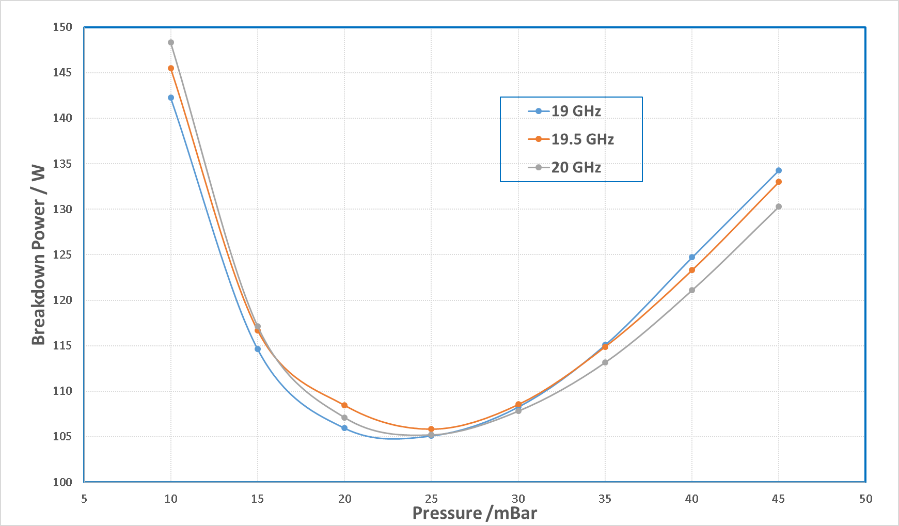
Once we have computed the EM fields, we can proceed with the high-power analysis. We have calculated the gas breakdown threshold with Spark3D under these conditions:
- Gas environment: dry air
- Pressure range: between 10 and 45 mBar.
- Frequency range: between 19 and 20 GHz (the EM fields were computed at 19, 19.5 and 20 GHz).
Fig. 3 shows the breakdown power level vs. the pressure for the three different frequencies. The minimum occurs at around 25 mBar and for an input power close to 105 W.
High-Power Test
Experts in RF design and high-power tests conducted the measurements at Exens Solutions (Gradignan plant) facilities. The objective of this corona test was to validate and confirm the value predicted by the Spark3D analysis.
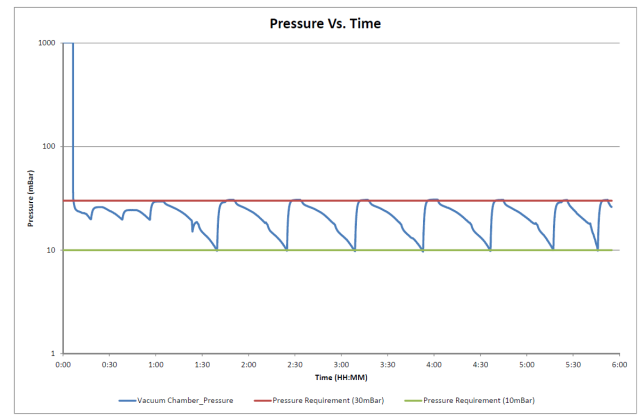
The component and part of the test bed were located inside the vacuum chamber to decrease the pressure inside the device to levels around the critical pressure (the pressure in which the breakdown power threshold is minimum, compare to Fig. 3). Once in that range (around 20 mBar), pressure cycles between 10 and 30 mBar were applied. We show the pressure profiles over time in Fig. 4. As you can see, the test duration was about 6 hours. With each pressure cycle the input power of the lowpass filter was increased.
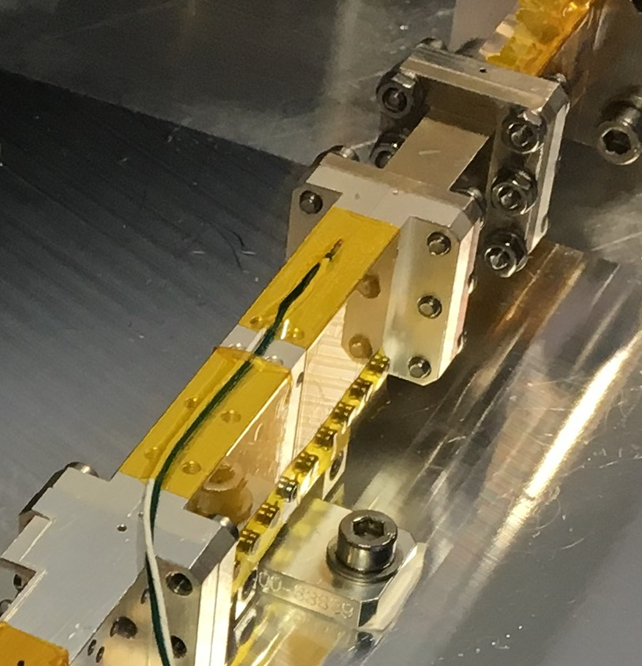
The measurement system monitored different test data such as the return loss, the insertion loss and the temperature of the device, to detect the discharge. Fig. 5 shows an image of the device under test (DUT) inside the test bed. The measured breakdown power level was found to be between 115 and 120 W in the frequency band between 19-20 GHz. This agrees very well with the simulated data shown in Fig. 3 in which the minimum breakdown power level is, approximately, 105 W, providing a safety margin around 0.4-0.6 dB.
In Fig. 6, we show the return loss during the complete test duration and its sudden change when the discharge took place (at around 6 hours after the start of the test).
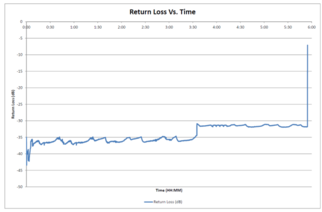
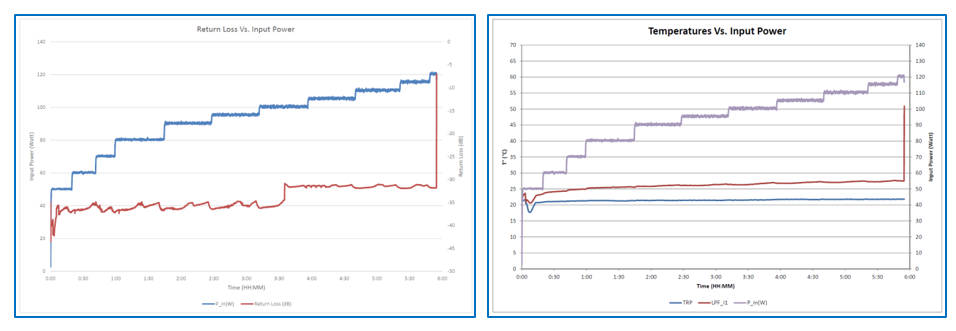
Fig. 7 depicts the return loss and the temperature at the DUT versus the input power during the complete test duration. The graphs clearly show the discharge moment in which both the return loss and the temperature increase instantaneously.
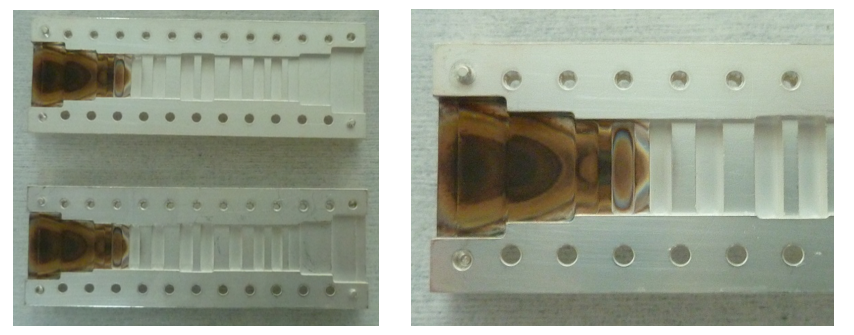
After the test, we opened the lowpass filter to identify the location of the discharge (see Fig. 8). The damaged side corresponds to the input power port. Indeed, the breakdown ignited around the center of the device, increasing the signal reflection there and generating a standing wave towards the input port. This, in its turn, increased the electric field in that region enhancing the discharge, increasing the temperature, which finally burnt the device surface.
Summary
In this blog post, we have shown the results of a benchmark to demonstrate the accuracy of Spark3D analysis of gas discharge. The benchmark compares Spark3D breakdown results to measurements performed by Exens Solutions in a lowpass waveguide filter operating in Ka-band. The comparison between the simulation results and the test data agree with a margin of around 0.5 dB.
Interested in the latest in simulation? Looking for advice and best practices? Want to discuss simulation with fellow users and Dassault Systèmes experts? The SIMULIA Community is the place to find the latest resources for SIMULIA software and to collaborate with other users. The key that unlocks the door of innovative thinking and knowledge building, the SIMULIA Community provides you with the tools you need to expand your knowledge, whenever and wherever.

Katie is the Editor of the SIMULIA blog, an expert in engineering and scientific communication, and a strategic digital marketer. Katie has a BA in English and Writing from the University of Rhode Island and a MS in Technical Communication from Northeastern University. She is also a proud SIMULIA advocate, passionate about democratizing simulation for all audiences. Katie is a native Rhode Islander who lives just outside of her favorite city, Providence. She is a true New Englander and loves sharing all the cool things NE has to offer. She enjoys a variety of hobbies including history, astronomy, science/technology, science fiction, true crime, fashion and anything associated with nature and the outdoors. She is also mom to a 6-year old budding engineer and two crazy rescue pups.