
Buildings globally consume 35% of global energy and around 55% of total electricity [1]. Heating, Ventilation and Air Conditioning (HVAC) systems account for major portion of total building energy consumption, typically 40% of total building energy consumption [2]. Space cooling was responsible for about 16% of buildings sector final electricity consumption in 2020 [3]. Heat accounted for almost 50% of global final energy consumption in 2018 and is the world’s largest energy end use [4]. Hence, energy efficient HVAC equipment and system will play a significant role in improving the energy efficiency of buildings [5].
Apart from being energy efficient, it is important that a building HVAC maintains healthy indoor environmental quality [IEQ] that includes indoor air quality, as well as acoustic and thermal comfort. HVAC components and systems can cause health problems and discomfort. Noise from HVAC poses a health risk for inhabitants of the buildings and also in the surrounding community. The health risk includes hearing loss, annoyance, and disturbance of concentration or sleep [6]. HVAC is one of the major sources of interior noise in buildings [7]. HVAC design should focus on efficient use of the equipment and provide acceptable sound levels that do not cause discomfort in occupied spaces of the building and in the surrounding community.
Fans are a crucial component in HVAC systems. For example, fans are used in air conditioners, cooling towers, heat pumps, blowers, etc. Fans consume 40% of electricity in HVAC systems and are quite inefficient [8]. Noisy fans cause discomfort. To make the long story short, there is a need for efficient and quiet fans which will also help improve overall system efficiency. An effective design of efficient fans would require iterating towards a better design, typically leveraging a three-dimensional simulation of a rotating geometry. Furthermore, the performance of these fans is highly dependent on the integration in the full HVAC system.
HVAC manufacturers like Johnson controls are using advanced computational fluid dynamics simulation in their design [9]. LG [10] provides CFD analysis as part of HVAC Engineering Tools to suit the professionals. Several engineering solution providers [11,12] for example, LEAP are using CFD simulations in their building HVAC design. It is interesting to note that the acoustic comfort is not necessarily included in CFD assessments. Given the increasing demand from customers and green building certifications [13] to maintain IEQ that includes acoustic comfort, we are well equipped to meet the demand for acoustic assessment as well as IEQ in general.
Energy savings can be achieved by two approaches. One is through development of the HVAC component in the design phase and the other is assessing the performance of the components of the HVAC when they are integrated in a building, i.e. the installed phase. It is essentially optimization of design at two levels to achieve comfortable indoor environment including acoustic comfort and energy efficiency simultaneously.
In this article, these two approaches are applied to a system integrated axial fan. The first aspect of the design loop focuses on the CAD driven optimization of the axial fan in a cooling tower accounting for aerodynamic and aeroacoustic performance. The components of the cooling tower are shown in Figure 1a.
In the second part, the impact of the fan design in the overall HVAC system performance is assessed, and represented as a reduced order 1D model. The cooling tower integrated in a building is shown in Figure 1b.
HVAC component in the design phase
In our example, the CAD design of the axial fan geometry is parametrized that provides control of leading and trailing edge angles and of radius. A short video sequence showing the change in fan geometry design as a result of changing trailing and leading edge is shown in Figure 2.
A set of design parameters namely delta pressure, mass flow rate and torque are defined that the fan must meet. A Computational Fluid Dynamics (CFD) RANS simulation is performed on 3DEXPERIENCE Platform with Fluid dynamics role based on the initial set of parameters. An example of the simulation results is shown in Figure 3. Once the initial design parameters are verified, Design of Experiments (DOE) for the fan can be performed for varying operating conditions using Process Composer and Result Analytics on platform. The CFD simulation model runs in DOE loop for different fan geometries and operating conditions. A total of 120 runs were performed in 6 hours. Automated mesh regeneration is performed following a change in geometry. The fan is designed to meet a design criteria. A fan is built to work in front of a heat exchanger. The fan has its own delta pressure vs mass flow rate curve, and the heat exchanger has its own pressure loss vs mass flow rate curve. For a given mass flow rate (which is determined based on the expected heat transfer required to “unload” the thermal state from the liquid in the radiator, a fan has to have a pressure loss at least higher than the pressure drop of the radiator, and the lowest torque possible. In modern HVAC systems, the heat transfer required will vary as a function of the operating condition of the rest of the components of the HVAC, so not only the pressure condition and low torque target needs to be satisfied for one mass flow rate, but for a range of mass flow rates. An optimal design is chosen from the available set of runs based on this criteria.
Learn more on our HVAC Discover Page!
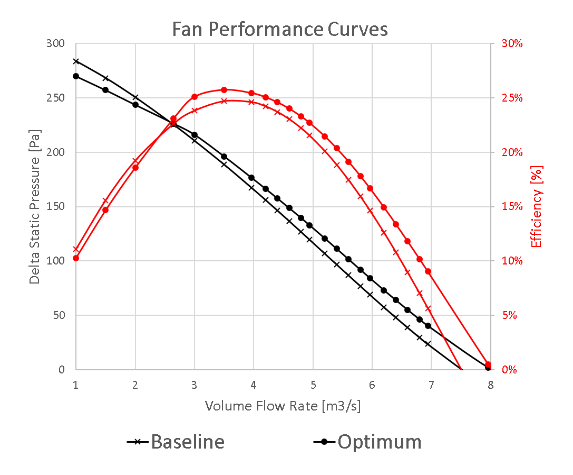
The fan performance curve can be computed from simulation in a couple of hours or from response surface (extrapolated from several DOE results) in order of seconds. The curve in Figure 4 shows the improvement in pressure gradient and energy efficiency throughout the operating range for cooling tower for the optimized design. Each point on the curve corresponds to a simulation and each simulation is about 20 to 30 minutes. It is particularly critical to have higher efficiency over a wide range of operating conditions for fans with variable speed. Designing of such fans requires that aeroacoustics are captured and accounted for a wide range.
The aeroacoustic performance is assessed to measure the sound levels of the fan in study. Full 3D simulations are performed with the CFD solver PowerFLOW. The cooling tower is simulated with accurate representation of drift eliminator and the fill pack is simulated as a porous media. Both the baseline and optimum design are simulated. The CAD geometry of the new iterated design is imported into PowerDELTA template for tesselation of CAD and PowerFLOW ready surface mesh is automatically generated. If the automatically generated surface mesh is not PowerFLOW ready, then user has to manually fix the mesh using the editing tools in PowerDELTA. For most cases, the new simulation ready file is generated with ease by just replacing the baseline mesh with the mesh for optimum design for the fan. PowerACOUSTICS is used for the post processing of acoustic results. The comparison between the Sound Power Level (SPL) plots for two cases is shown in Figure 5.
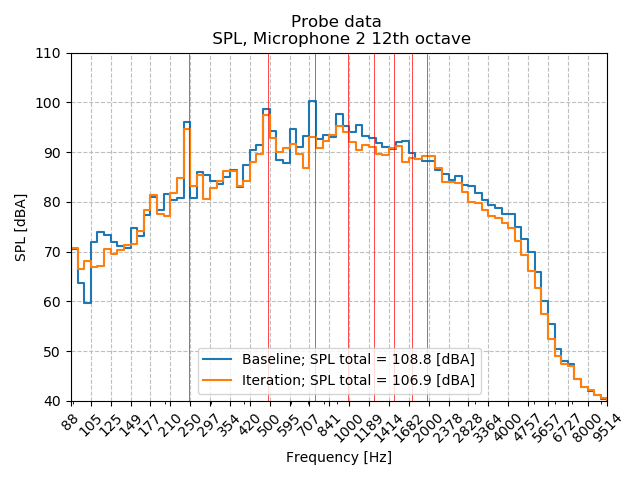
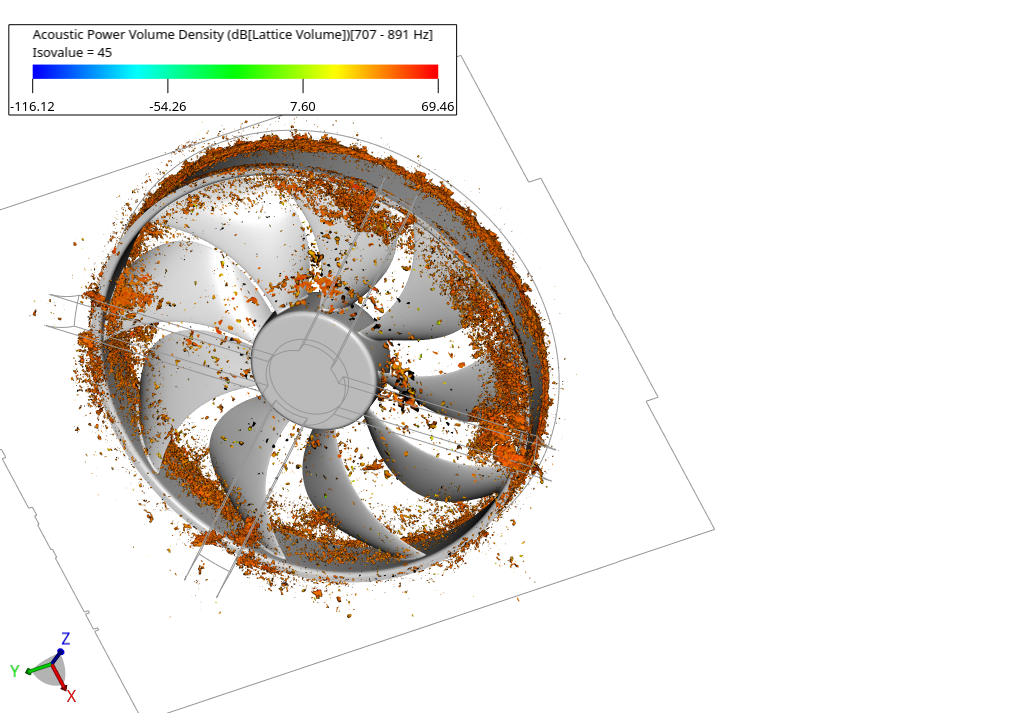
There is a reduction in tonal noise and overall sound pressure levels. Changes in blade tip leading edge and location of the fan affects the detachment of the flow and therefore has an impact on tonal noise. Broadband noise sources can be identified using Flow Induced Noise Detection (FIND). Areas of high acoustic power are identified as shown in Figure 6. Surface fluctuations of rotating geometries can be assessed using rotating power spectrum (RPS) as shown in Figure 7.
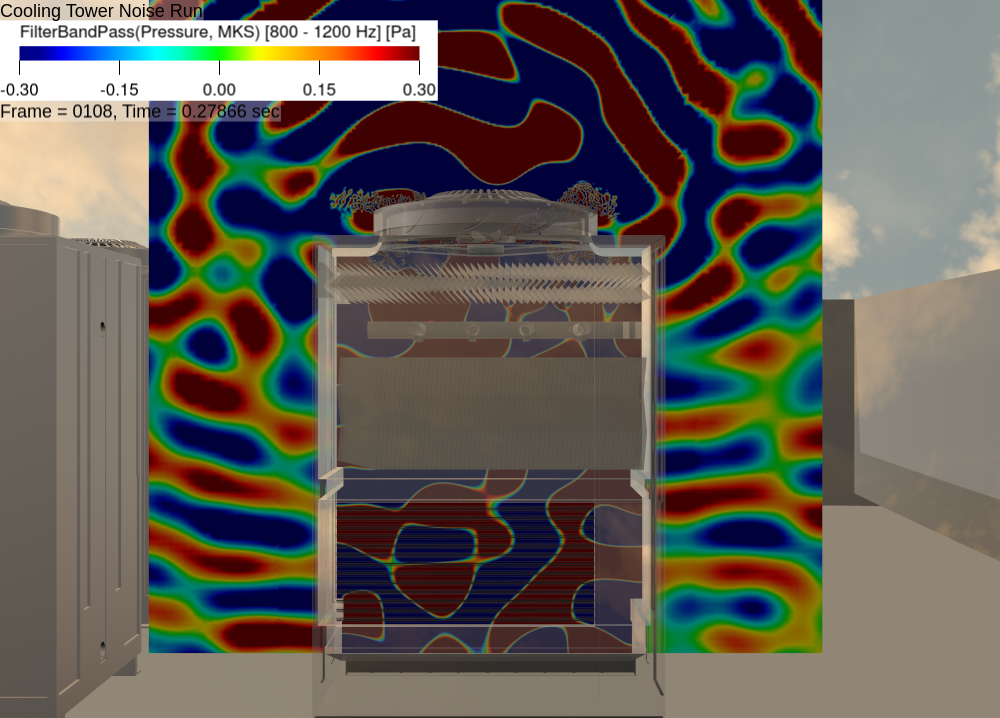
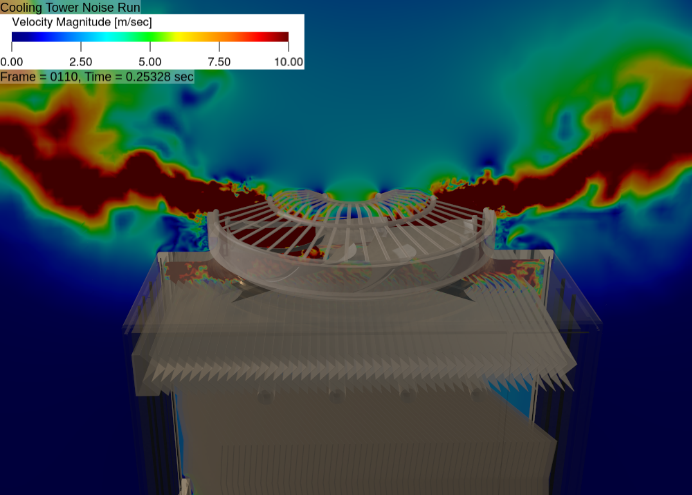
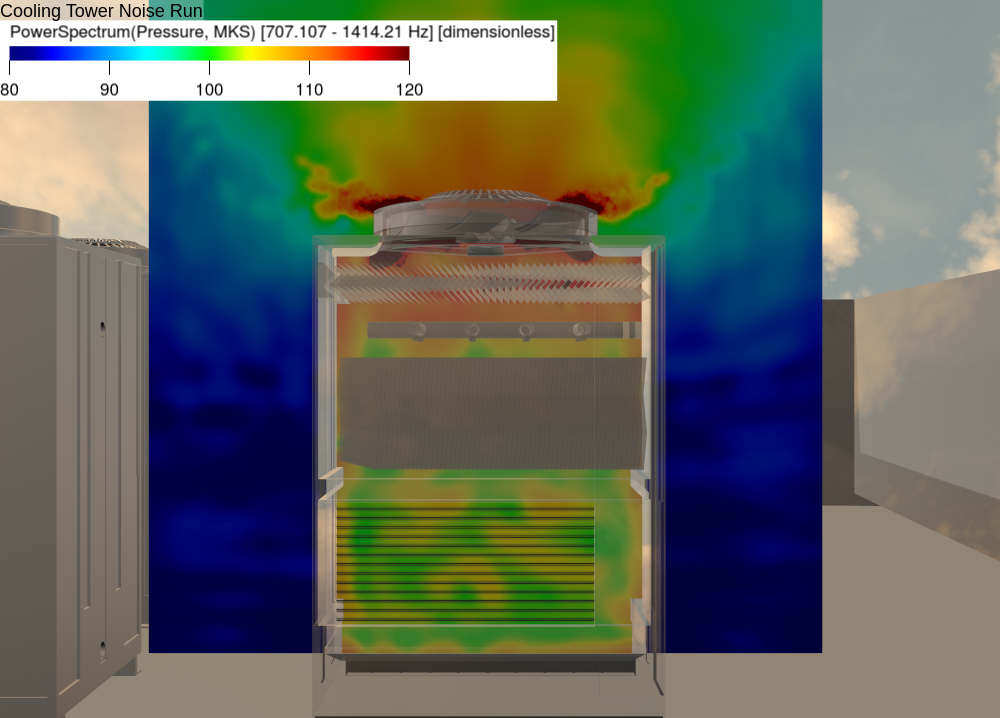
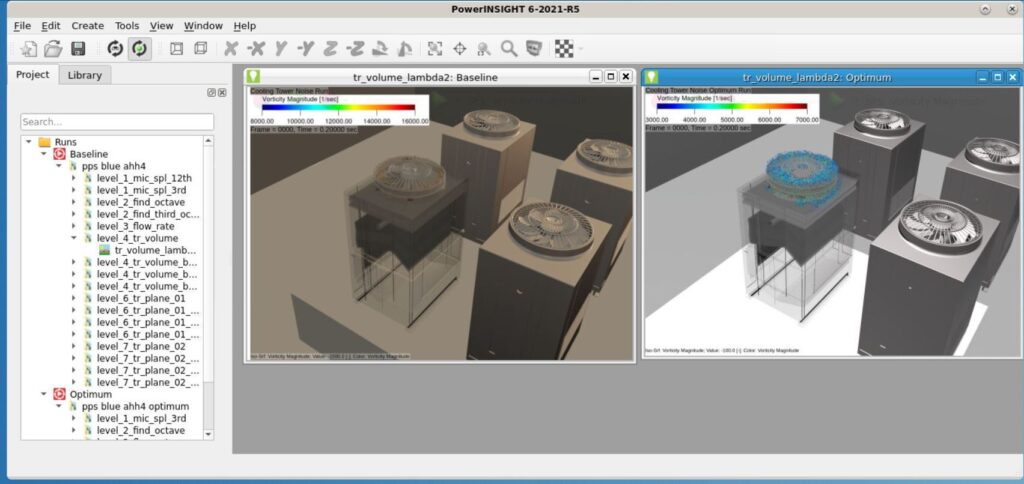
Courses on FIND and rotating power spectrum are available on learning center. Band pass filter for the frequency range of interest can be used to identify the location where the acoustic waves are emanating from and their interaction can also be seen as shown in Figure 8. Velocity and dB maps profiles are shown in Figure 9 and 10 respectively. The results can be visualized and compared in PowerINSIGHT with ease. An example is shown in Figure 11.
A hands-on fan noise workshop was also organized to show participants how to solve aeroacoustic challenges with our fan system development process.
HVAC in installed phase
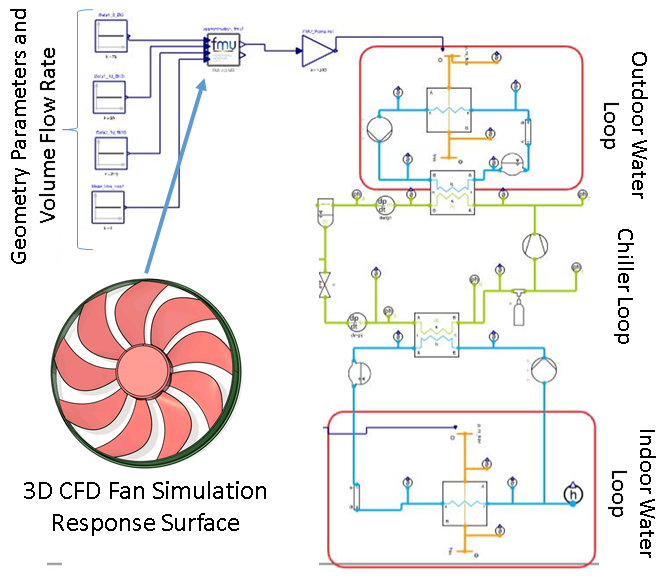
Last but not the least, modeling the integrated HVAC system of a building with its components installed in operating conditions is essential to achieve a truly efficient system. Dymola is used for system modeling solutions. The HVAC system performance is represented as a set of 1D reduced-order model nodes. The system model shown in Figure 12 represents the HVAC assembly with three loops namely Outdoor Water Loop, Chiller Loop and Indoor Water Loop. Fan is represented for Cooling Tower in the Outdoor Water Loop. The response surface of the fan with performance varying as a function of its geometry changes, is used to represent the fan performance in the 1D model. Energy consumption is measured accordingly. Modeling the integrated system enables the computation of equipment efficiency, for example EER and SEER [14] and can be then used to meet the rating requirements.
The example in this study demonstrates the effectiveness of modeling the integrated HVAC system and shows coupling with 3D CFD is essential to achieve an optimized system using the tools of Dassault Systèmes while balancing fan operating efficiency, costs of development by analyzing several fan configurations, acoustics comfort and energy efficiency. A separate comparative study also presented the usage of system modeling and 3D CFD for balancing human thermal comfort, IAQ and energy efficiency. This was presented at Nafems World Congress 2021 [15].
References:
- United Nations Environment Programme (2020). 2020 Global Status Report for Buildings and Construction: Towards a Zero-emissions, Efficient and Resilient Buildings and Construction Sector – Executive Summary. https://wedocs.unep.org/20.500.11822/34572.
- Factsheet HVAC energy breakdown (September 2013), https://www.environment.gov.au/system/files/energy/files/hvac-factsheet-energy-breakdown.pdf
- IEA (2021). Cooling, IEA, Paris. https://www.iea.org/reports/cooling
- IEA (2019), Renewables 2019, IEA, Paris. https://www.iea.org/reports/renewables-2019/heat
- HVAC Energy Saving Strategies for Public Buildings Based on Heat Pumps and Demand Controlled Ventilation, Energies (2021), 14(17), 5541; https://doi.org/10.3390/en14175541
- Ortiz,M., Itard,L., Bluyssen,P.M., Indoor environmental quality related risk factors with energy-efficient retrofitting of housing: A literature review, Energy and Buildings, Volume 221, 2020, 110102, ISSN 0378-7788, https://doi.org/10.1016/j.enbuild.2020.110102
- HVAC Applications, ASHRAE Handbook (2011), Noise and vibration control, Chapter 48.
- Nejc B., REHVA Journal (February 2012). How to improve energy efficiency of fans for air handling units. https://www.rehva.eu/rehva-journal/chapter/how-to-improve-energy-efficiency-of-fans-for-air-handling-units
- Johnson Controls showcases latest products to help buildings become more efficient and sustainable at ACREX 2018. URL: https://www.johnsoncontrols.com/en_in/media-center/news/press-releases/2018/02/22/jci-showcases-latest-products-at-acrex-2018
- The End Game: HVAC Engineering Tools to Suit the Professionals (Part 3 of 4) – LG HVAC STORY, 2021. URL: https://www.lghvacstory.com/the-end-game-hvac-engineering-tools-to-suit-the-professionals-part-3-of-4/
- 4 core applications where CFD is changing the HVAC & Construction industry. https://www.computationalfluiddynamics.com.au/4-core-applications-where-cfd-is-changing-the-hvac-construction-industry/
- HVAC Computational Fluid Dynamics (CFD) Analysis Services. https://pureprimesol.com/engineering-services/hvac-cfd-analysis-services/
- Licina, D., Wargocki, P., Pyke, C., & Altomonte, S. (2021). The future of IEQ in green building certifications. Buildings and Cities, 2(1), 907–927. DOI: http://doi.org/10.5334/bc.148
- Wikipedia contributors. (2022, January 18). Seasonal energy efficiency ratio. In Wikipedia, The Free Encyclopedia. Retrieved 10:31, March 23, 2022, from https://en.wikipedia.org/w/index.php?title=Seasonal_energy_efficiency_ratio&oldid=1066355206
- https://www.nafems.org/publications/resource_center/nwc21-374/

Join a community of simulation enthusiasts focused on advancing the use of SIMULIA simulation solutions in science and engineering! It’s free and easy. Start a discussion with other members of the SIMULIA Community. Talk through your simulation questions with peers, SIMULIA experts, and SIMULIA Champions. Apply to be an author to create posts, share useful tips you discovered for SIMULIA software, and establish yourself as a thought-leader. The SIMULIA Community is home to both SIMULIA product users and SIMULIA subject matter experts around the world.

Katie is the Editor of the SIMULIA blog, an expert in engineering and scientific communication, and a strategic digital marketer. Katie has a BA in English and Writing from the University of Rhode Island and a MS in Technical Communication from Northeastern University. She is also a proud SIMULIA advocate, passionate about democratizing simulation for all audiences. Katie is a native Rhode Islander who lives just outside of her favorite city, Providence. She is a true New Englander and loves sharing all the cool things NE has to offer. She enjoys a variety of hobbies including history, astronomy, science/technology, science fiction, true crime, fashion and anything associated with nature and the outdoors. She is also mom to a 6-year old budding engineer and two crazy rescue pups.