
Work conducted in partnership with XRG Simulation GmbH
Buildings are the critical places where we live, work and rest. Any buildings constructed today are expected to remain for at least the next 50 years, so it is imperative that new buildings follow green standards, including with regards the integration of HVAC systems; in addition, the decarbonization of existing buildings is necessary to help tackle climate change. Buildings are solely responsible for almost 40% of global energy consumption and 33% of greenhouse gas emissions. A recent study by the European Commission shows that around 75% of buildings in the EU are not energy efficient, with many relying on fossil fuels for heating and cooling. Similarly, according to the US Energy of Information & Administration, 48% of energy consumption in US homes is due to heating and cooling.

It is widely considered that System Modeling simulations are sufficient for sizing the HVAC for all weather conditions and buildings. In this study, we will show the advantages & disadvantages of sizing the HVAC using only System Modeling, comparing this to an approach combining system modeling with 3D CFD. We will demonstrate the need to use integrated simulation processes, outlining the circumstances under which System Modeling and 3D CFD are required to investigate key performance indicators for energy consumption, thermal comfort and IAQ, and assess present and even future usage scenarios.
Sizing HVAC with System Model
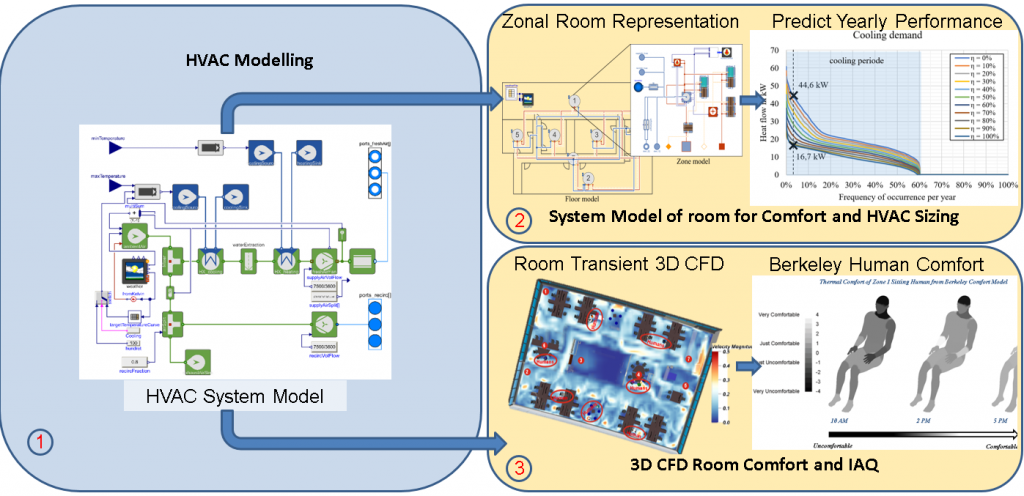
System simulations are a very efficient approach to obtain target HVAC air temperatures, benefiting from a quick turnaround time, and providing results for different sized buildings studied over several days or even years. System Modeling is the appropriate cost effective tool to get an initial sizing estimate of the climate system needs. Using Dymola 2022 and HumanComfort library, the model of the metal building shown in the video above is sub-divided in 7 zones, connected with each other through fluid and heat flows. Its associated air handling unit (AHU) equipment is modeled using the HVAC library. A weather model is then applied on top of the building, providing all necessary information about temperature, humidity, direct and diffuse solar radiation and the sun position.
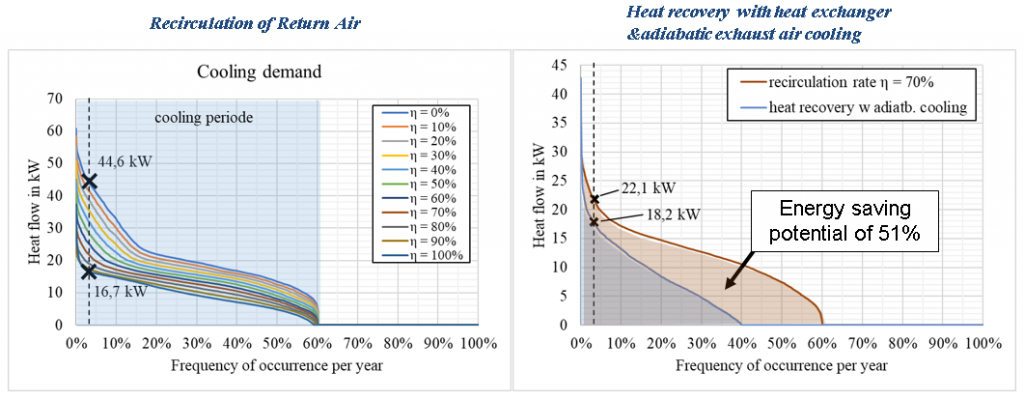
A simulation with 100% air recirculation and space cooling of the building is carried out with the coupled building & HVAC system model. Yearly results allow estimating the cooling power required at 15kW to cover 90% of the cooling needs, for specific operational conditions of the AHU (volume flow of 7500 m³/h, with maximum target temperature of 26°C and the nominal supply air temperature of 20°C). Lowering the supply inlet temperature to 15°C requires a cooling power of 28kW to cover 99% of the yearly cooling needs. Recirculation of return air decreases the cooling needs but is not suitable when considering spreading of harmful particles. A highly efficient alternative is to use a heat recovery unit. The interior air quality (IAQ) is then also improved since 100% fresh air is supplied to the building with a heat recovery unit. Figure 1 shows the cooling demand over the year with recirculated air & recovery unit.
System models can also be used to predict the building temperatures and thermal comfort for the full year period. The zonal comfort metrics provided by the system model do not necessarily provide the optimal accuracy to maximize energy efficiency and IAQ. Hence, we integrate the System-Model results with a coupled 3D CFD approach to assess the flow and thermal exchange locally and assess their impact on thermal comfort.
Need & Benefits from 3D Simulation
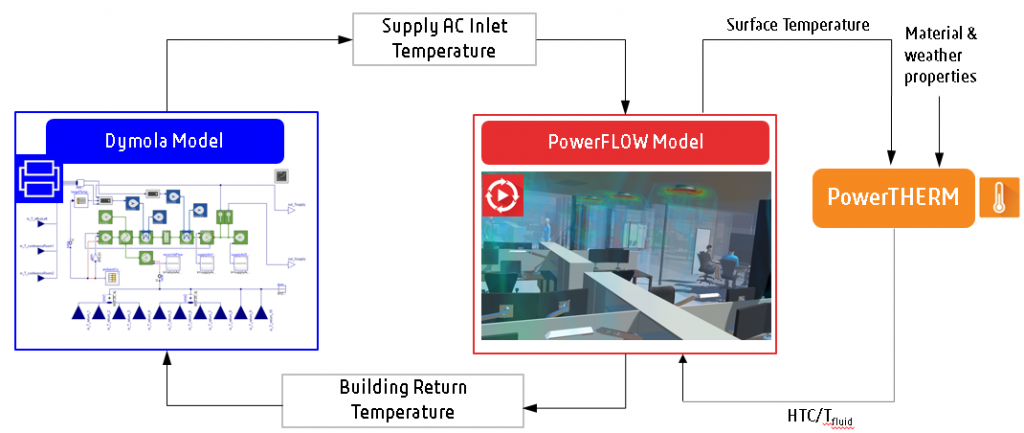
In the integrated simulation, the System model representation of the office room (2) is replaced with a 3D CFD model (3), whilst the complete HVAC layout (1) from System Model continues to be modeled as shown in Figure 2.
The PowerFLOW-PowerTHERM 3D CFD simulation coupled with the Dymola System Model is carried out for a period of 12 hours, from 7 AM to 7 PM with occupants inside the building. The effects of solar radiation, ambient temperature, ambient humidity and sun position are included. The coupled simulation , including Berkeley human comfort modeling, is carried out to match the worst day investigations from the System-Model results, with identical boundary conditions. The flow simulation shows the effect of diffuser on the flow behavior inside the building wherein the cold dense air from the diffusers falls directly to the floor before rising up. This leads to less diffusion close to the ceiling, with most of the flow mixing occurring at the floor level. During the coupled simulation, the properties are dynamically changing and updated with time. The controller in the System-Model stabilizes the temperature and reduces the oscillation in the output after each coupling. The integrated PowerFLOW-PowerTHERM model is shown in Figure 3.
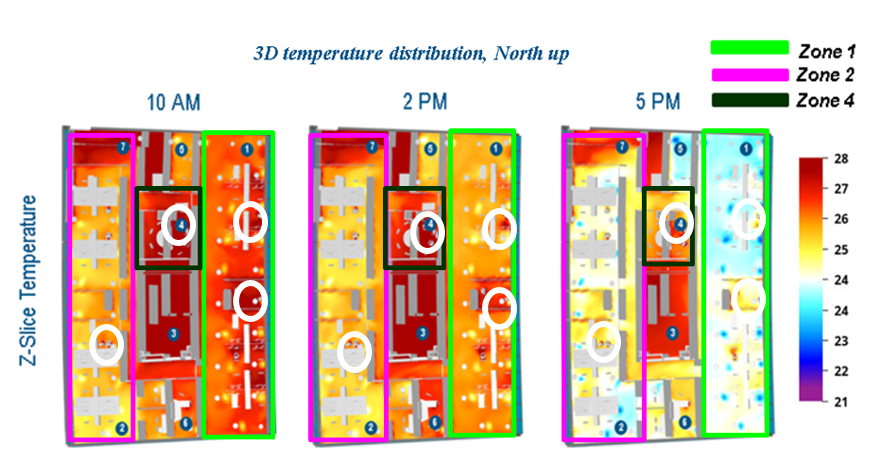
The fluid temperatures in the 3D model were found to be 1 to 2K higher than for the System-Model for certain zones. The main difference is more due to localized impact of solar radiation and flow currents. Local spatial and transient temperature changes with varying solar load and its effect on thermal comfort can be clearly captured in a 3D simulation. In the morning, higher temperatures are seen in the parts of the building mainly Zone 1 where the solar load is the greatest and it decreases as the sun moves to the other side. Asymmetrical temperature variations are also captured well and 2 humans sitting on different ends can experience drastically different comfort levels as a function of the balance of solar radiation and vent positioning. The impact of localized temperature and solar load can be seen on the thermal comfort of the occupants. The local comfort of the worst body parts affects overall comfort. For example, occupants in Zone 1 receive lot of solar radiation in the morning increasing the skin temperature and the local thermal sensation of head and neck. Hot thermal sensation and high discomfort can be seen for the Zone 1 human in Figure 4.
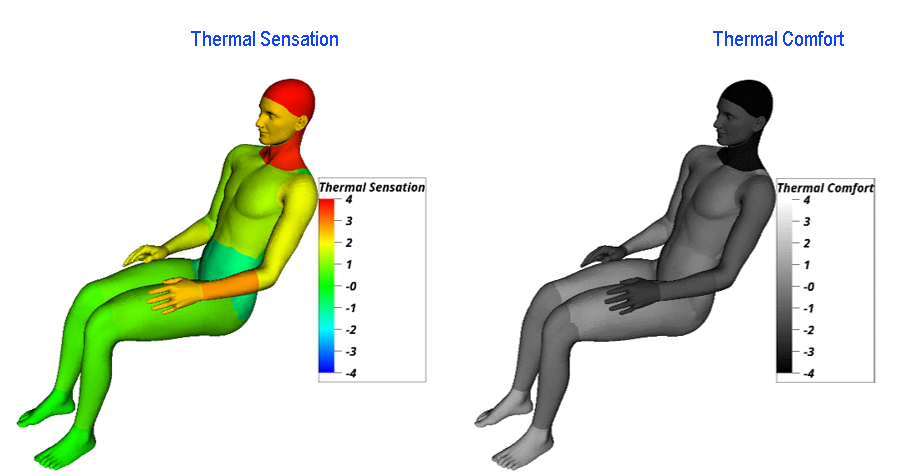
The head and neck are very uncomfortable and it brings down the overall comfort for the certain time as shown in Figure 5. The zone 2 occupant, sitting away from the window and receiving good air flow, and the Zone 4 occupant, sitting in a convection dominated area are just comfortable throughout the day. Different Zones and occupant positions (represented by circles) are shown in Figure 5.
Thermal Comfort Metric
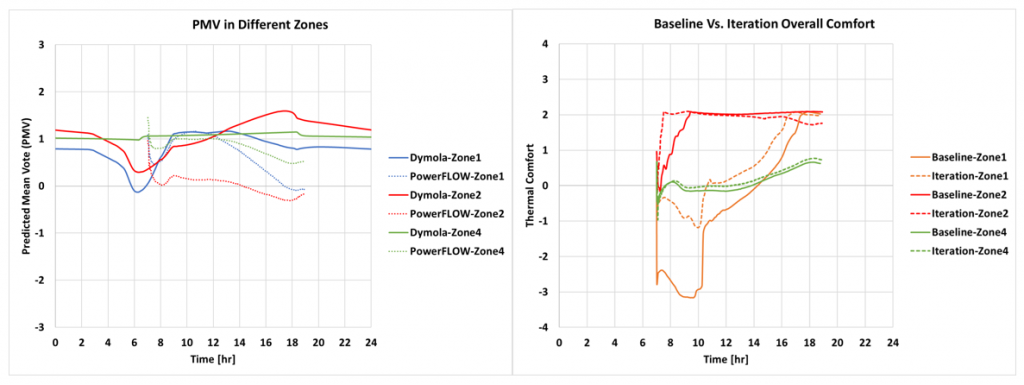
As per ASHRAE, Predicted Mean Vote (PMV) is the most recognized thermal comfort metric used for building simulations. However PMV provides accurate predictions mostly in uniform controlled environments, and considering the body as a whole. Results that show local asymmetry of temperatures, with transients and high thermal gradients, require advanced comfort algorithms to determine thermal comfort. As seen in Figure 6, the zonal System-Model PMV is in agreement with local CFD PMV for Zone 4, a zone which demonstrates less thermal gradients & solar load. But in more heterogeneous zones like Zone 2, a higher difference is observed due to zonal averaging in the System-Model. Similarly, comparisons between local CFD PMV & the more advanced Berkeley comfort model show that the high discomfort observed for occupants in Zone 1 is better captured with the Berkeley model than with PMV. Lastly, the System-Model indicates that solar load should be reduced everywhere in the building, whereas the 3D CFD Berkeley model indicates that this needed only for certain zones, reducing construction material cost.
Based on 3D simulation results, a design change is carried out with a reflective low-emissivity (E) coated glass for the windows. Improved comfort is seen in Zone 1 compared to baseline due to the reduced incident solar load inside the building. With the correct glazing materials, higher comfort can be achieved quickly with a reduced HVAC load, thus increasing the energy efficiency of the building. Moreover the simulation indicates that the glazing could be modified only in the areas of the building that need it, reducing cost, increasing natural light, and promoting higher energy efficiency in the winter (when less reflective glazing would be preferred). These areas can be pinpointed effectively with the 3D results as shown in Figure 6.
Importance of IAQ
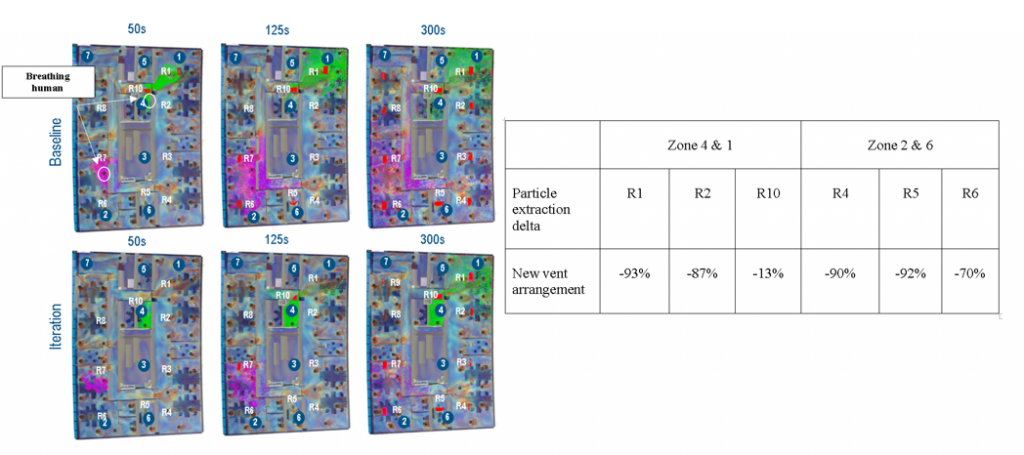
The importance of 3D simulation to predict the air quality concurrently with thermal comfort is studied for 2 talking humans emitting contaminated particles every 60 seconds. In a first baseline simulation, no vents are present in the conference room from Zone 4, and airflow is supplied from all the vents in the hallway in Zone 2. In Zone 2, the occupant is thermally comfortable and the particles spread uniformly, with aerosols propagated by convection. The particles from Zone 4 with no vents leave the conference room, enter the hallway carried along the flow current and accumulate across the North East of Zone 1, where another HVAC outlet R1 can extract them from the room. Although the filtering of aerosols is adequate with this configuration, Zone 4 is not thermally comfortable. Hence, HVAC flow outlets are taken from Zone 2 where there is more cold air flow than required. The revised run however leads to less particles being extracted from Zone 4. This is due to an increased flow recirculation inside the room with the vent arrangement, limiting the amount of air reaching the hallway, and being convected by the hallway current to R1 as shown in Figure 7. In Zone 2, the reduced air flow rate from the removed HVAC inlet leads to less particle dispersion and extraction by HVAC. In this specific circumstance, changes that led to an improvement in comfort and energy efficiency also increased the risk of particle contamination from unclean air.
Conclusion
This study presented a comparative assessment of the usage of System-Modeling and 3D CFD for balancing human thermal comfort, IAQ and energy efficiency. Although initial system sizing and yearlong energy efficiency predictions should be done using System-Modeling approaches, it was shown in the presented scenario that comfort results obtained from System-Models can be insufficient, and lead to incorrect engineering decisions and additional costs. Furthermore, IAQ information, which should be leveraged concurrently with a thermal comfort assessment, can only be obtained from a transient 3D CFD simulation with accurate turbulence representation. Supplementing System-Models with 3D transient CFD is therefore recommended to ensure an optimal and cost effective balance of thermal comfort, IAQ and energy efficiency. The Industry Process Experience “Built Environment Performance Analysis” aims to tackle these challenges, by offering HVAC manufacturers and the construction industry the tools needed to deliver optimal and energy efficient Indoor Environmental Quality.
To learn more about SIMULIA’s HVAC solutions, please visit the HVAC page in the SIMULIA Community.

SIMULIA offers an advanced simulation product portfolio, including Abaqus, Isight, fe-safe, Tosca, Simpoe-Mold, SIMPACK, CST Studio Suite, XFlow, PowerFLOW and more. The SIMULIA Community is the place to find the latest resources for SIMULIA software and to collaborate with other users. The key that unlocks the door of innovative thinking and knowledge building, the SIMULIA Community provides you with the tools you need to expand your knowledge, whenever and wherever.

Vijaisri Nagarajan is working as an Industry Process Expert Specialist in the Climate Systems team. She received her PhD in Mechanical Engineering from University of Nevada, located in Las Vegas. She joined Dassault Systèmes first as a member of thermal team and then Climate Systems. She has been heavily involved in the development of our Cabin Comfort, Defrost and thermal management solutions since then. She is now working on the development and deployment of Cabin Comfort solutions for Industrial Equipment.