

Once a geologist has completed a drill program to test for mineralization, sterilization or geotechnical information, they may want to view the results of the drill holes in a plan view to recognize trends in geology without having to flip between graphical drill logs and plan sheets.
These plots can also be draped over topography and an aerial image to create a summary map to quickly show information that may be needed when discussing the planning stages of the mine.
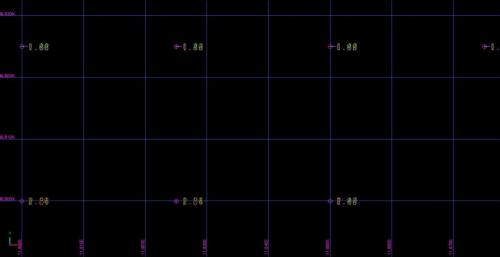
The below diagram shows a drillhole collar plot before displaying drillhole traces on a plan view…
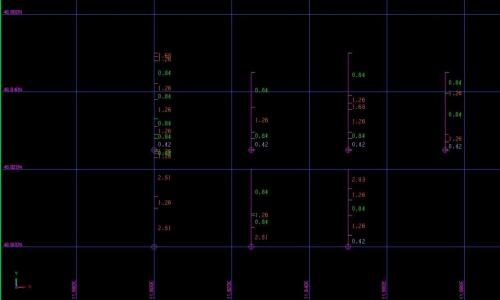
…and after displaying drillhole traces on a plan view with associated assay grades.
To begin, open up the drillhole database in Surpac.
1. Database > Administration > Create field. Create a new field in the survey table of the database: plotting_plan_dip. 2. Database > Edit > Field maths. Use field maths and set this new field to have a dip of 0.

3. Database > Database > Map the Database.
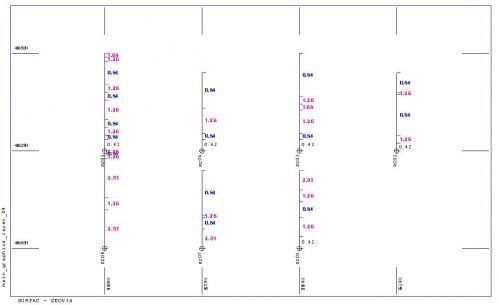
Create a new .ddb file called “surpac_plan_plotting”. Map the survey dip field to this new field. Below is the plot of the drillholes using the autoplot function.
You may also be interested in reading 10 Steps for Extracting Drillholes as a String File. Or, find out more about Surpac’s Geological Drillhole Database.