

In our last post, we saw how to contour soil assay results in GEOVIA Surpac using the DTM method, whereby we created a DTM of the assay data and contoured the DTM surface.
There is also another way to get the same result, using a grid and interpolating a grade into the grid, then contouring the grid. Today I’ll be talking about this second method.
We will use the gridding function to generate an interpolated grid of the variable within Surpac.
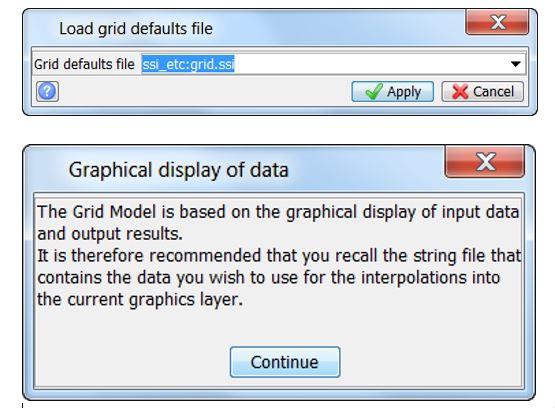
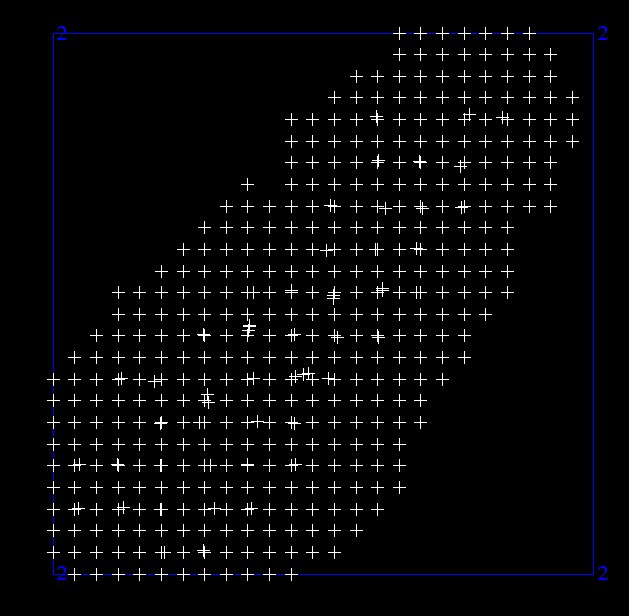
- First, open up your raw data in the graphics window of Surpac. Then go to Surfaces > Contouring > Begin Contouring. Select Apply to all the forms.
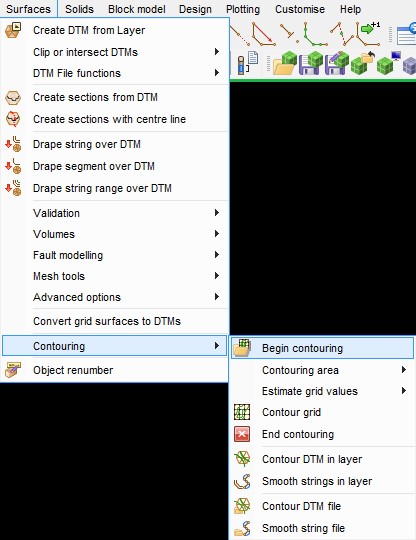
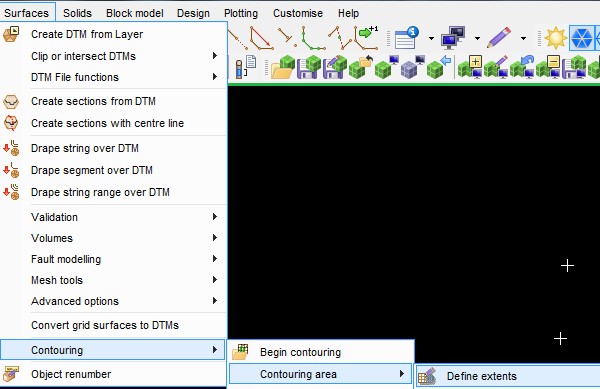
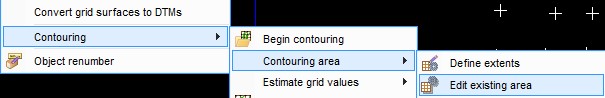
2. Next, go to Surfaces > Contouring > Contour Area > Define extents.
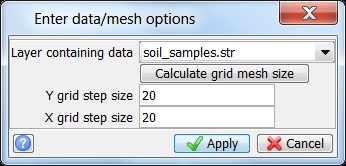
4. Adjust the step size (grid cell size) if need be and round the coordinates up/down to the nearest number if required. The origin is the bottom left-hand corner of the box.
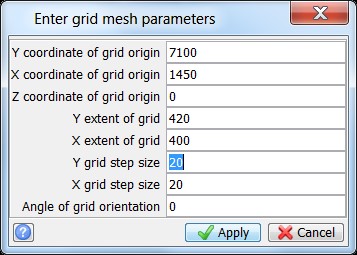
5. Select Apply and a blue box will appear. You can see that in this example I have adjusted the coordinates a bit too much and need to re-adjust. Re-adjust the extents by going to Surfaces > Contouring > Contour Area > Edit existing area.
Remember, the origin is the bottom left-hand corner of the box. Shift this to ensure you capture all your data and then adjust the extent size.
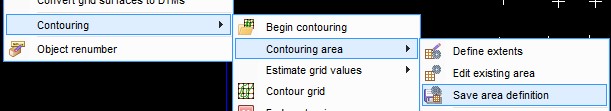
6. Once you have correctly selected your area, go to Surfaces > Contouring > Contour Area > Save area definition. Select Apply to all the forms.
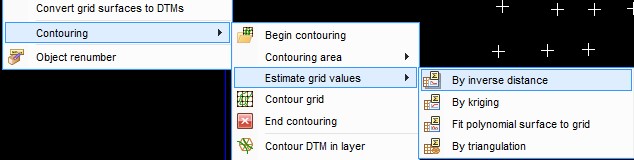
7. The data is now ready to estimate. We will use the “By inverse distance” option here.
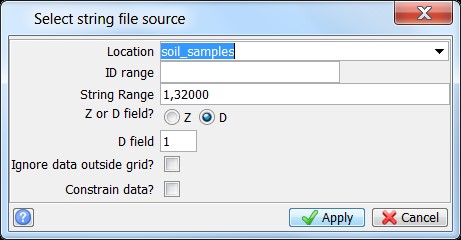
8. Select the string file containing the data and specify the specific D field which you wish to grid. In this example it is in D1.
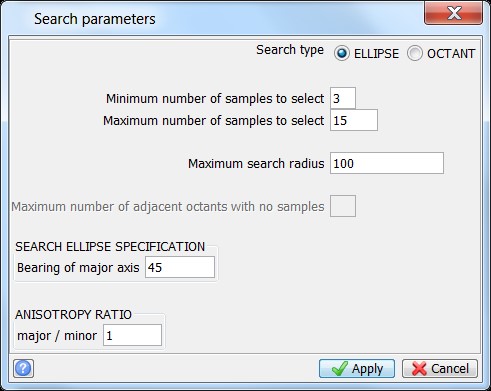
9. Specify your search parameters. Click Apply.
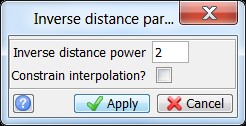
10. Specify your inverse distance power and click Apply.
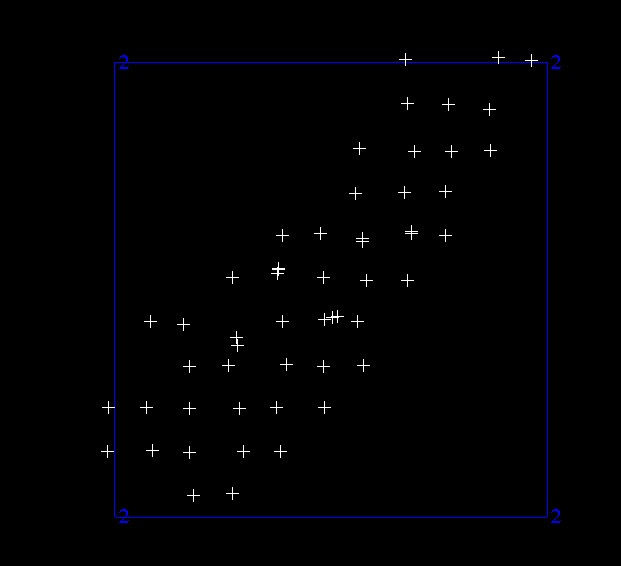
11. Data has now been estimated into a 20×20 grid over the entire area.
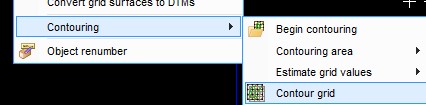
12. We can now contour the model by going to Surfaces > Contouring > Contour Grid.
13. Select the contour intervals and the colours.
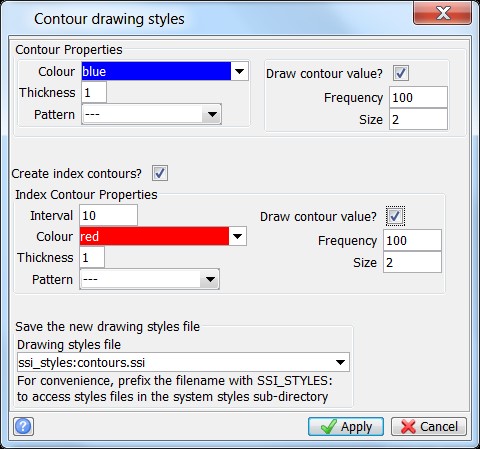
14. The data is now contoured, and the contour interval is displayed on each line. Save the layer.
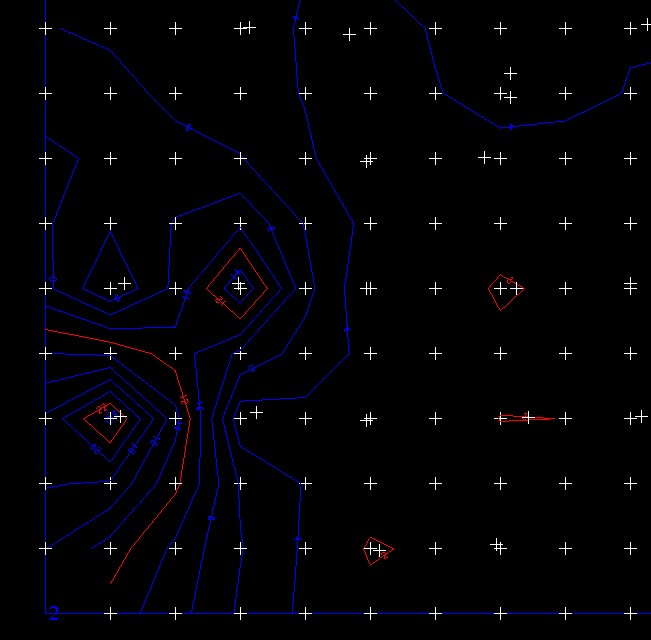
With assay data now displayed as contours, this may assist in interrogating the data for the purposes of refining drill targets, assist in resource modeling or conceptual mine design.
If you missed Method 1, check out Contouring Soil Assay Results Using DTM Method in GEOVIA Surpac.