

As geologists, we commonly work with contoured images. These may be created from soil samples, topography, base of oxidation and so on. By contouring the data which we have in point form, we are able to recognize patterns in the data that can guide us to new exploration targets or assist in building geological models.
In this post, we will be working with the results from a recent soils sample program over a possible exploration target and we want to contour the data to assist in the drill planning. There are two ways you can do this within GEOVIA Surpac.
Method 1: Generating a DTM of the assay data and contouring the DTM surface
Method 2: Using a grid and interpolating a grade into the grid, then contouring the grid.
This blog post will focus on Method 1, with a subsequent blog post talking about Method 2. Read on for the tutorial!
- In Surpac, open the soil sample data into the graphics layer.
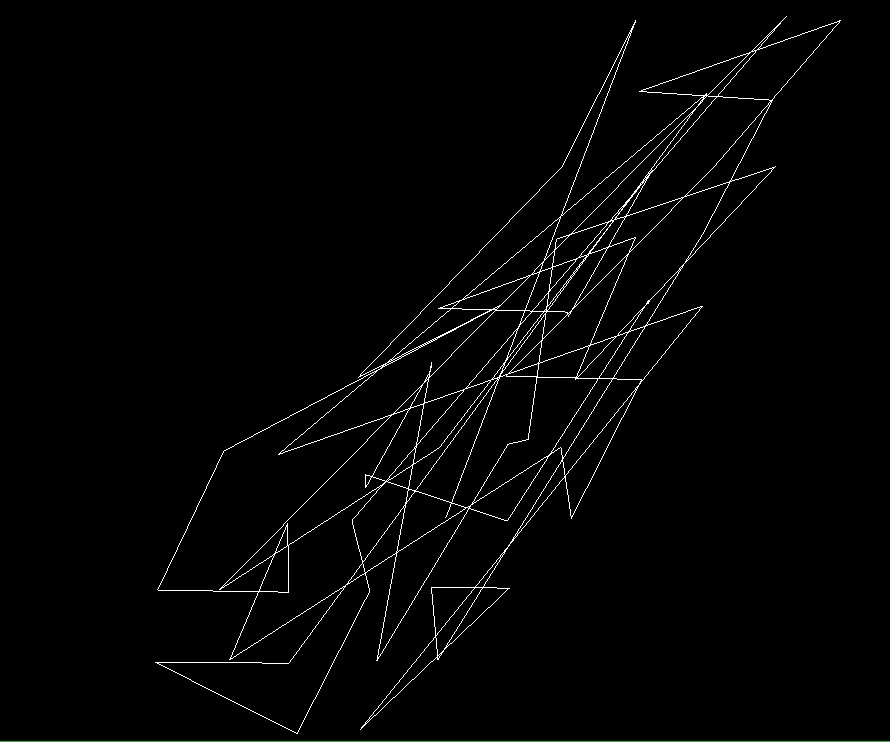
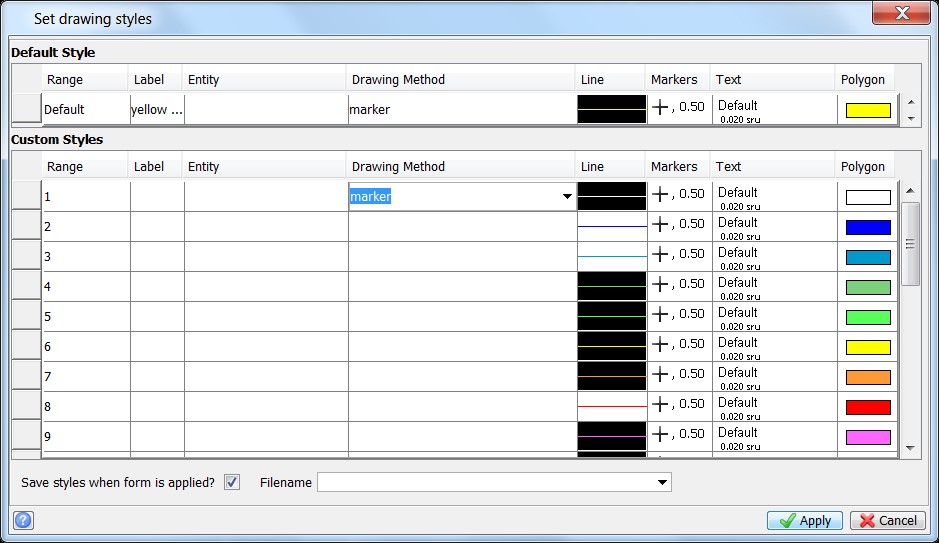
2. Go to Customize > display properties > strings and points, then change the drawing method to marker. You can then save the styles file if you wish, or leave the line blank, which changes the display on the fly, for the creation of the DTM.

3. Next, go to Surfaces > Create DTM from layer. There are two plane types the DTM is created on, “best fit plane” and the “the xy plane”. Note: Make sure you view the resultant DTM, as the two plane types produce different results.
4. Save the DTM that best fits your data.
5. Use the inquire toolbar as shown below to find out what field the assay data is in. In this example, the data is in d1.

6. Select Surfaces > Contouring > Contour DTM in layer. Note that if your dataset is big, it is recommended to use the file-based method (Surfaces > Contouring > Contour DTM file), rather than the graphics-based method.
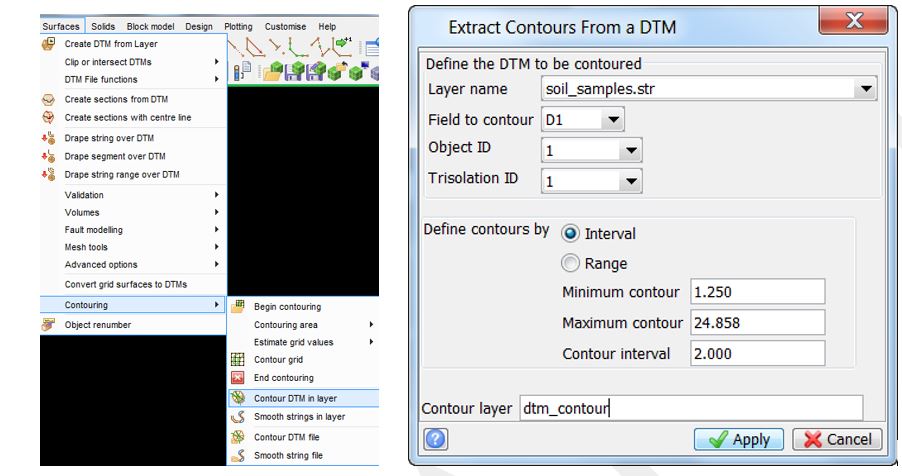
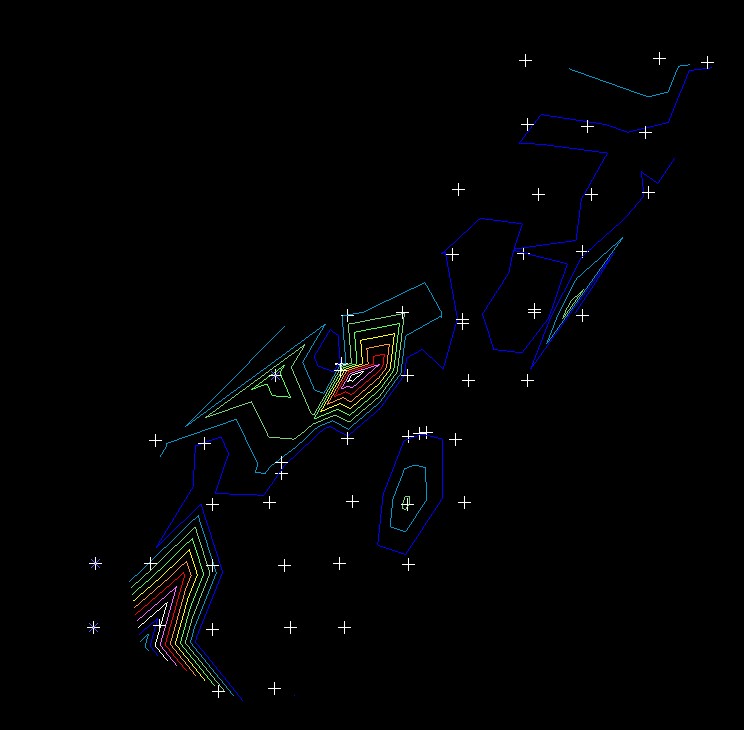
7. In this example, the result is written into a layer ‘dtm_contour’.
With assay data now displayed as contours. this may assist in interrogating the data for the purposes of refining drill targets, assist in resource modelling or conceptual mine design.
In the next post, we will talk about Method 2: Using an interpolated regular grid to contour the data.
For more information on contouring, you may be interested in Creating Contours From a DTM Surface for Plotting.