
A team from the SIMULIA brand of Dassault Systèmes has been awarded the first place prize for predicting the residual strains within as-built IN625 3D printed parts in CHALLENGE 1: Macro-scale Process-to-Structure Predictions in the Air Force Research Laboratory (AFRL) Additive Manufacturing software (AM) Modeling Challenge Series. Learn more about the challenge problems in the post below.
Team members Ryan Benyshek, North America Industry Process Consultant at Dassault Systèmes Government Solutions and Kaushik Das, Developer Senior Manager SIMULIA used the latest features of the Dassault Systèmes 3DEXPERIENCE platform including AM process simulation apps from the SIMULIA brand and 3D Printing preparation apps from the DELMIA and the CATIA brands in this challenge.
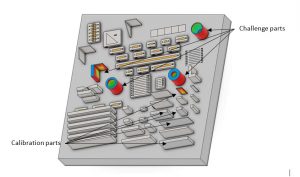
The challenge was to accurately predict macroscale residual elastic strains in additively manufactured (AM) Inconel 625 components. The organizers at AFRL provided experimentally measured residual strains for plates of different lengths and thicknesses, shown as calibration parts in Figure 1, to help with calibrating simulation parameters. Participating teams were to report residual strain components at specified locations of challenge articles, shown as challenge parts in Figure 1. The organizers did not publish experimentally measured strains of challenge parts before the report submission deadline. AFRL evaluated all submitted results against experimentally measured strains and placed Dassault Systèmes team’s results as 1st out of 6 submissions, and awarded it with a Top Performer certificate.
The 3DEXPERIENCE platform provided a complete end-to-end solution including: (1) CAD model preparation; (2) slicing the geometry; (3) generating the AM machine toolpath, and (4) simulating the printing process.
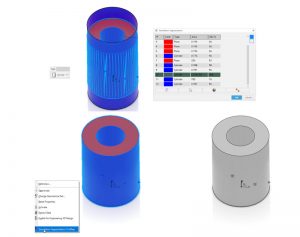
First, we reconstructed a CAD geometry from the STL files provided by AFRL. A native CAD geometry was helpful in generating a finite element (FE) mesh. The CATIA Digitized Shape Preparation app was used to repair and validate STL mesh. The Tessellation Segmentation feature available in the CATIA Digitized Shape to Surface app automatically identified the canonical regions of the STL mesh and converted it to B-Rep. For example, it fully captured the surfaces that consisted of 358 triangles for one of the cylindrical parts, as shown in figure 2 and instantly converted them to a B-Rep. The FE model creation later removed the alignment NUBS. To convert the areas where there were vertex defects due to the text markings of the geometry, we sliced the STL mesh with a planar section, and then converted it to a sketch. Then we padded the sketch to form a solid geometry in the CATIA Part Design app.
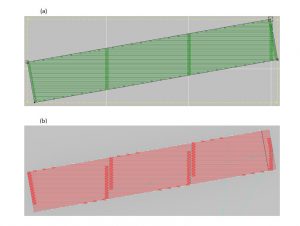
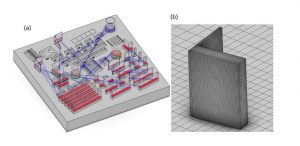
In the second step, we generated scan paths of the laser and slicing of the geometry using the DELMIA Powder Bed Fabrication app on the native CAD geometry according to all parameters of the scan strategy provided in the problem statement. Accurate prediction of the strain required an accurate consideration of total thermal energy and input heat flux per layer. We considered the entire build setup and sliced all the parts in the build even when some components were unused in simulation (see Figure 4a). This guaranteed that scanning and recoating time or the total printing time of each layer was as accurate in the simulation as in the printing process. For example, printing times of later layers on the taller parts were shorter than those for initial layers when all the shorter parts were still being build. Using the DELMIA Powder Bed Fabrication app, we recreated the scan path as accurately as the path used in the EOS machine. Figure 3 compares the scan paths generated in the DELMIA app with a figure of scan path provided by AFRL used in the build process.
Subsequently, using the SIMULIA Additive Manufacturing Scenario app, we constructed a high-quality finite element (FE) mesh from the CAD geometry (see Figure 4b). We performed a sequentially coupled thermomechanical-analysis of the AM process using the Scenario app. The SIMULIA Additive Manufacturing Scenario app provided a computationally efficient and a highly scalable framework for simulating AM processes. The framework allowed activation of elements in a progressive fashion during the analysis. A continuously evolving free external surface, that reflected the present shape of the part at a given time during the build process, participated in radiative and convective heat transfer. A moving heat flux simulated the laser heat source with its energy uniformly distributed over a laser spot-sized region. The toolpath-mesh intersection module computed the element activation sequence, the heat energy input, and the evolving free external surface by intersecting the toolpaths of the laser and the recoater and the FE mesh in a geometric sense. This framework also provided an automatic time incrementation scheme to control the fidelity of the solution with mesh refinement.
We performed a transient heat transfer analysis, taking into account the material deposition sequence for element activation and the scanning path of the laser beam for heating. The temperature field of the transient heat transfer analysis was used to drive a static structural analysis.
The FE mesh consisted of 8-node linear diffusive heat transfer DC3D8 elements for the heat transfer analysis and full-integration solid C3D8 elements for the stress analysis. A tie constraint connected the printed parts structurally and thermally to the build plate. All displacement degrees-of-freedom of the build plate were fixed and constant temperature of 80°C was specified. The initial temperature for the printed parts for the heat transfer analysis was 25°C. In the structural analysis, the initial temperature of the build part was set to a relaxation temperature of 1200°C, above which thermal straining induced negligible thermal strain. Upon element activation, it represented the temperature from which the thermal contraction occurred.
Temperature dependent elastic and thermal properties were used. The material properties for bulk IN625 provided by AFRL was used. Parameters of the Johnson-Cook plasticity model were calibrated to match the provided supplemental data with the Materials Calibration application on the 3DEXPERIENCE Platform. The modulus of elasticity of bulk IN625 was assumed to be anisotropic and was modified higher than the provided data to better correlate with the strain reported for the calibration parts.
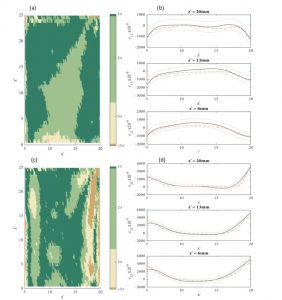
Figure 5 shows strains in (a and b) the longitudinal and (c and d) the printing directions on the 1 mm leg of the L shaped part. The dotted red lines in Figure 3(b) and (c) are the simulated microstrain, the black lines are the experimental value and the grey lines show interval of 2σ (500 microstrain) around experimental values. On a large portion of the part, the simulated strains are within 2σ interval of the experimentally measured strain.
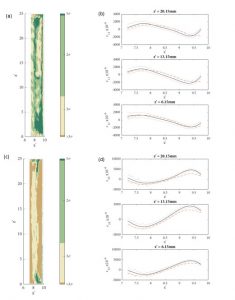
Figure 6 depicts strains in the radial and the printing directions on a long section (x-z plane) of the 5 mm cylindrical part. On a large portion of the part, the simulated radial strains are within 2σ interval of the experimentally measured strain. Whereas the strains in the printing direction was within 3σ interval of the experimentally measured strain on almost enter part. The dotted red lines in Figure 6 (b) and (c) are the strain from simulation, the black lines are from experiment and the grey lines show interval of 2σ around the experimental curve. The variation of strains along the printing direction (x) at given heights (z) from simulation qualitatively aggress with those found experimentally.
SIMULIA offers an advanced simulation product portfolio, including Abaqus, Isight, fe-safe, Tosca, Simpoe-Mold, SIMPACK, CST Studio Suite, XFlow, PowerFLOW and more. The SIMULIA Learning Community is the place to find the latest resources for SIMULIA software and to collaborate with other users. The key that unlocks the door of innovative thinking and knowledge building, the SIMULIA Learning Community provides you with the tools you need to expand your knowledge, whenever and wherever.

Katie is the Editor of the SIMULIA blog, an expert in engineering and scientific communication, and a strategic digital marketer. Katie has a BA in English and Writing from the University of Rhode Island and a MS in Technical Communication from Northeastern University. She is also a proud SIMULIA advocate, passionate about democratizing simulation for all audiences. Katie is a native Rhode Islander who lives just outside of her favorite city, Providence. She is a true New Englander and loves sharing all the cool things NE has to offer. She enjoys a variety of hobbies including history, astronomy, science/technology, science fiction, true crime, fashion and anything associated with nature and the outdoors. She is also mom to a 6-year old budding engineer and two crazy rescue pups.