Introduction
Digital twins are computer models of their real-life counterparts. They are developed using continuum-based physics-driven simulation technology and artificial intelligence/machine learning algorithms. At first, primarily used in industries like transportation & mobility, aerospace & defense, and cities & infrastructure, they are now increasingly applied in less conventional market segments such as life sciences & healthcare. According to Fortune Business Insights, the digital twin market in Europe is the third largest worldwide. In contrast, the global digital twin market is projected to grow to USD 137.67 billion by 2030 from a value of just USD 8.60 billion in 2022 [1]. Dassault Systèmes is a leader in virtual twin technology, and this SIMULIA blog post aims to substantiate that claim. A prior blog post has reported previous collaborative simulation work between Weldex, a Tier I automotive component supplier, and Dassault Systèmes on thermal headlight defrost [2]. This blog post extends that work by optimizing the headlight defrost time using a parametric design study (PDS) performed on Dassault Systèmes’s pioneering 3DEXPERIENCE Platform with its native Navier-Stokes-based computational fluid dynamics (CFD) solver called FMK encapsulated in the Fluid Dynamics Engineer role.
Methodology
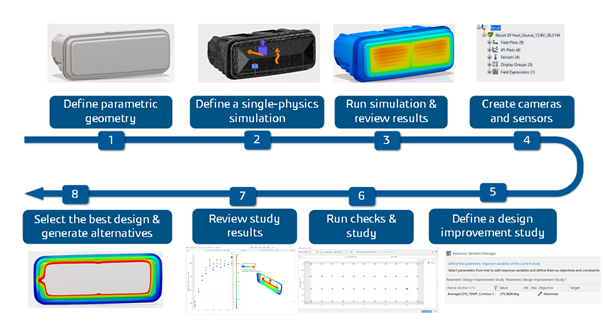
A Modeling and Simulation (a.k.a MODSIM) workflow is employed as part of the PDS methodology. MODSIM leverages Dassault Systèmes’s combined computer-aided design (CAD) and simulation portfolio advantage. These computer-aided engineering disciplines are divided into the CATIA and SIMULIA brands. More specifically, with MODSIM, a parameterized CAD model is directly connected to its downstream CFD simulation scenario. Any alterations to the CAD model by changing the geometry’s parametric parameters automatically lead to an updated mesh in the CFD simulation scenario. Through MODSIM, the entire simulation workflow is left-shifted, enabling an earlier use of CFD simulation in the design process, thereby reducing late-stage failure and cutting product development time drastically. The entire PDS workflow for the thermal headlight defrost CFD simulation setup, with the embedded MODSIM process, is depicted in Figure 1. The individual steps are subsequently described in more detail:
- First, in step 1, define the geometry parameters that the PDS is meant to explore the influence of on the optimization target.
- Next, in steps 2 to 3, run a single CFD simulation of the baseline set-up. This is a sanity check to make sure that the simulation has been configured correctly.
- After that, in step 4, define the camera positions and sensors that are meant to be used in the PDS to assess / compare the results of each simulation.
- Following that, in step 5, specify the design improvement study by selecting the optimization target.
- Subsequently, in step 6, set the number of simulations that are to be run in the PDS optimization study and run checks to make sure that the automatically generated (through MODSIM) simulation set-ups are actually feasible from a geometry perspective.
- In step 7, use the PDS graphical-user-interface to review the produced results per simulation run.
- And finally, in step 8, select the optimal case and/or generate design alternatives based on the optimized geometry.
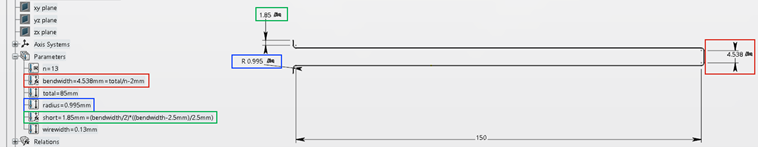
Having described the general MODSIM and PDS workflow, the parameterization of the headlight geometry from Weldex must now be detailed. The overall shape of the headlight casing cannot be changed, as this is dictated by the original equipment manufacturer purchasing the headlight from Weldex; the headlight must fit into the general assembly of the vehicle. Therefore, the only way to influence the headlight’s defrost time is by changing the shape of the heating wire filament that spans the headlight front. It is the wire that is parameterized. The parameters are summarized in Figure 2.
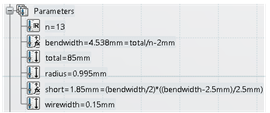
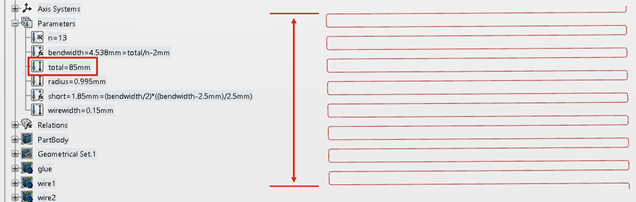
It is essential to differentiate between the parameters constraining the parameterization and the actual variable parameters. Figure 3 shows that the first constraint is the “total” height of the wiring; it cannot surpass 85mm. Figure 4 illustrates the remaining constraints. The “radius” of the wire turns is fixed at 0.995mm, the “bendwidth” (that is, spacing) is computed from the “total” height and “n,” which represents the number of horizontal wire segments, and, finally, the “short” end length of the wiring is computed from the “bendwidth.” In the end, the only two variable parameters actively altered in the PDS are “n” and “wirewidth,” representing the wire diameter.
With the MODSIM-based geometry parameters dictated, the simulation scenario set-up is briefly described. It resembles the headlight defrost simulation detailed in the previous SIMULIA blog post between Dassault Systèmes and Weldex [2]. Most importantly, the phase change is enabled by adding a spike in the temperature-dependent specific heat capacity at 0°C. The spike should be such that its integral (“the area under the curve”) equals the heat of fusion for water. In addition, a critical simulation parameter that needs to be specified is the Joule heating (a.k.a. Ohmic heating) value of the wire filament. As Equation 1 illustrates, Joule heating (P) depends on the voltage (V) applied, the cross-sectional area (A) of the wire, the resistivity (ρ) of the wire material, and the wire’s total length (L):

For the PDS exploration step, the voltage is set to 12.8V and the resistivity to 1.68e-8Ωm (for copper). The cross-sectional area is bounded by a wire diameter range of 0.1-0.2mm, which was provided by Weldex. Meanwhile, the length of the wire is physically bounded by “n” ranging from 9 to 19; anything beyond these bounds is geometrically impossible. From this information, a possible Joule heating range is computed. To streamline/simplify the process, an average Joule heating value for the PDS study is calculated. In the end, 32W is specified/selected.
Once the combined MODSIM and PDS workflow, as depicted in Figure 1, is complete, the five best cases are selected. The criteria for selecting these five best cases are as follows:
- They have to deliver high average “ice layer” temperatures by the end of the transient simulation.
- Their actual power output has to be close to the customer’s requirements of 30W. This means that wire configurations that perform well/better in the PDS are discarded if their true power output is very low due to theirlong wire length (see equation 1), meaning their true defrost time is much longer.
These five cases are then simulated with their correct Joule heating value, which is evaluated using Equation 1. From the five simulations with correct Joule heating value, the simulation with the highest average “ice layer” temperature by the end of the transient simulation is chosen to possess the best wire geometry for optimized headlight defrost time. It is important to note that, throughout this analysis, it is assumed that the highest average “ice layer” temperature at the end of the simulation time correlates with an earlier total defrost time, where the ice layer has been completely melted away.
Finally, with the best heating wire filament configuration found, material temperature bounds need to be checked. Specifically, the headlight casing is made of Makrolon, a polycarbonate, which melts when exposed to a temperature greater than or equal to 408.15K. To ensure the optimized wire configuration does not cause the plastic casing of the headlight to melt, a steady-state room temperature simulation of 293.15K is run with an applied heat load generated by 16V. These 16V are chosen, as the voltage applied could switch to this value should the micro-controller that dictates the voltage fail and switch to this default value. If the final steady-state temperature that the headlight casing is exposed to is lower than 408.15K, the optimized wire configuration is deemed acceptable.
Results
To begin, the design space explored in the PDS and its results are illustrated. As Figure 5 shows, 44 simulations are performed with the “wirewidth” varying from 0.12mm to 0.15mm, and “n” ranging from 9 to 19. At this stage, the generated simulation set-ups are checked for geometric feasibility. The window shown in Figure 6 is produced upon completion of the PDS. It shows a plot where the average “ice layer” temperature is compared to “n” and the “wirewidth”. The simulations at the lower end of the temperature range are discarded, as their average “ice layer” temperatures are low. Meanwhile, the simulations at the upper end of the temperature range are not considered further either, since their actual Ohmic heating value would be very low due to their long wire length (see Equation 1). The five best simulation scenarios for further simulation are chosen from the “n” range of 13 to 16, as indicated by the red box in Figure 6. This is because these set-ups have high average “ice layer” temperatures, and their actual Ohmic heating value is close to the requirement of 30W.
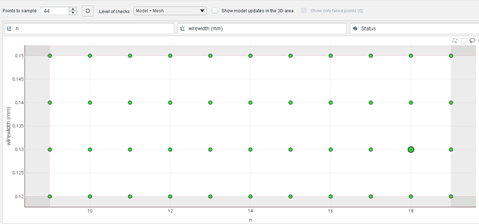
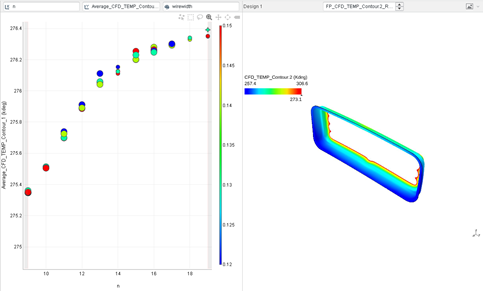
Table 1 contains the results of the five simulation setups run at their actual Ohmic heating value. The baseline setup is also compared to see the benefits of the improved configuration(s). In the end, the scenarios with “n” of 13 and “wirewidth” of 0.14mm, and “n” of 14 and “wirewidth” of 0.15mm are selected for the material test simulations (the rows are marked in green in Table 1). This is because these simulation set-ups:
- Provide Ohmic heating values that are almost equal to 30W.
- Have close to the shortest inflection point times, i.e. times where the phase change begins to end.
- And have almost the highest average “ice layer” temperature by the end of the transient simulation.
Although the setup with “n” of 13 and “wirewidth” of 0.15mm does appear to be the best design, it is deemed to have a power rating that is too far from the 30W target value provided by Weldex.
| Table 1: Best case simulations run at their true Ohmic heating value |
| Design (“n”, “wirewidth [mm]”) | Ohmic Heating [W] | Max Temp. [K] | Inflection Point [s] | Avg. Temp [K] |
| Baseline | 30 | 298.4 | 550 | 273 |
| 13, 0.14 | 30.49 | 302.6 | 535 | 273.8 |
| 13, 0.15 | 35.01 | 309.8 | 460 | 276.9 |
| 14, 0.15 | 30.82 | 303.9 | 518 | 274.1 |
| 15, 0.15 | 27.85 | 299.3 | 570 | 272.1 |
| 16, 0.15 | 25.4 | 295.3 | 614 | 270.5 |
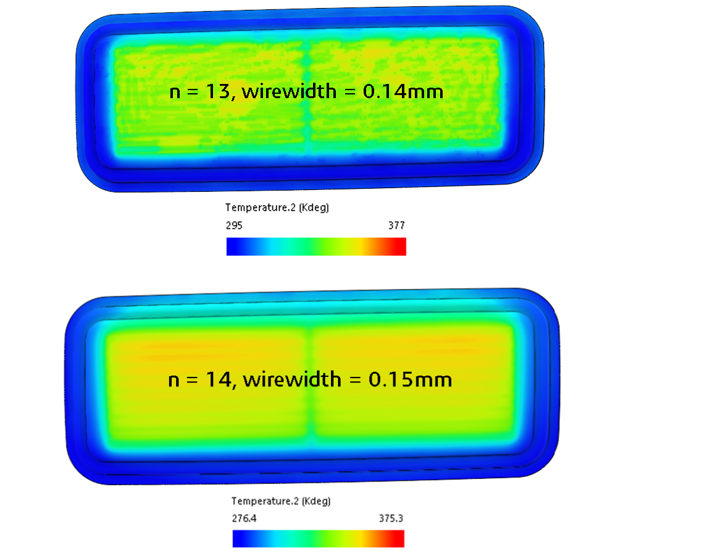
The simulations to test material bounds are run at steady-state with a room temperature value of 293.15K and a heat load generated by 16V. Overall, these simulations are run for a total of 2000 iterations. As Figure 7 depicts for both chosen designs, the final steady-state headlamp lens temperatures are well below the 408.15K threshold set by the Makrolon polycarbonate material. As such, it can be asserted that the two-wire geometries / designs for optimized (that is, shortened) headlight defrost time do not cause the plastic material of the headlight to fail by melting.
Conclusion
In conclusion, a MODSIM-based PDS is performed to assess the influence of wire filament geometry on defrost time of a Weldex headlight. Throughout this PDS, two parameters are actively varied: “n,” which is the number of horizontal wire segments, and “wirewidth,” which is the filament’s diameter. Five set-ups from the completed PDS are selected for simulation at their correct Ohmic heating value. From these five designs, two are pursued further, as they provide close to the highest average “ice layer” temperature by the end of the transient simulation, and close to the shortest inflection point time, which is deemed to be the point at which defrost has completed, while still being near the desired power rating of 30W: “n” =13 with “wirewdith”=0.14mm, and “n”=14 with “wirewidth”=0.15mm. In both cases, it is determined that, by running a steady-state room temperature simulation of 293.15K and applying a heat load generated by 16V, the Makrolon polycarbonate does not reach its melting temperature of 408.15K. Finally, this study shows that, while filament geometry impacts defrost time, a more noticeable impact can be achieved by applying a larger Ohmic heat load.
Future Work
Future work must explore the possibility of varying the heat load applied to the wire filament. This may be possible by conducting a design-of-experiment study generated through the 3DEXPERIENCE Platform’s Process Composer application.
References
- “Europe Digital Twin Market Size.“ Fortune Business Insights
- Hesse, F., Gandhi, F., Roh, M. “Illuminating Car Head Light Defrost Simulations – A Digitized Approach”

Interested in the latest in simulation? Looking for advice and best practices? Want to discuss simulation with fellow users and Dassault Systèmes experts? The SIMULIA Community is the place to find the latest resources for SIMULIA software and to collaborate with other users. The key that unlocks the door of innovative thinking and knowledge building, the SIMULIA Community provides you with the tools you need to expand your knowledge, whenever and wherever.
 Dr. Faron Hesse
Dr. Faron Hesse graduated with a MEng in mechanical engineering from the Imperial College of London in 2016. During this degree, he worked for one year as an Aerodynamic Performance Engineer at the Red Bull Racing F1 team, winning the championship with Sebastian Vettel. Faron then pursued a sponsored MRes in fluid dynamics, again at the Imperial College of London. Finally, prior to starting to work for Dassault Systèmes in 2019 as an Industry Process Consultant in the T&M Supplier Fluids division, Faron completed a PhD in vehicle aerodynamics at the Imperial College of London.
 Michel Haumer
Michel Haumer joined Dassault Systèmes as an intern in the Industry Process Consulting team in 2024. During his internship, he worked on computational fluid dynamic and computational aeroacoustics topics with the 3DEXPERIENCE Platform roles/apps. Upon completing his internship, he resumed his Masters studies on automotive technologies at the University of Stuttgart, where he is now gaining experience in combustion modeling.